

Question: The data show the high school dropout rate for students for the years 2003 to 2009. Construct a time series graph and analyze the graph.
The data show the high school dropout rate for students for the years 2003 to 2009. Construct a time series graph and analyze the graph.
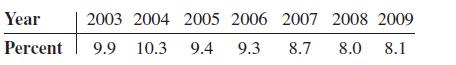
Year Percent 2003 2004 2005 2006 2007 2008 2009 9.9 10.3 9.4 9.3 8.7 8.0 8.1
Step by Step Solution
★★★★★
3.31 Rating (157 Votes )
There are 3 Steps involved in it
1 Expert Approved Answer
Step: 1 Unlock

Answer Above is the time series ... View full answer
Question Has Been Solved by an Expert!
Get step-by-step solutions from verified subject matter experts
Step: 2 Unlock
Step: 3 Unlock