

The data show the mean ranges for tides in coastal cities in the United States. The ranges
Question:
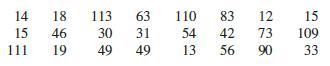
The data show the mean ranges for tides in coastal cities in the United States. The ranges represent the difference of the mean high water mark and the mean low water mark. Construct a frequency distribution using six classes. Summarize the results.
Fantastic news! We've Found the answer you've been seeking!
Step by Step Answer:

Answered By
Sagar Kumar
I am Mechanical Engineer with CGPA of 3.98 out of 4.00 from Pakistan. I went to Government Boys Degree College, Sehwan for high school studies.
I appeared in NUST Entrance Exam for admission in university and ranked #516. My mathematics are excellent and I have participated in many math competitions and also won many of them. Recently, I participated in International Youth Math Challenge and was awarded with Gold Honor. Now, I am also an ambassador at International Youth Math Challenge,
I have been teaching when I was in 9th class class year 2012. I have taught students from 6th class to university level.
1+ Reviews
10+ Question Solved
Related Book For 
Elementary Statistics A Step By Step Approach
ISBN: 9781260360653
11th Edition
Authors: Allan Bluman
Question Posted:
