

Question: The U.S. Census Bureau publishes data on the population of the United States by race and Hispanic origin in American Community Survey. From that document,
The U.S. Census Bureau publishes data on the population of the United States by race and Hispanic origin in American Community Survey. From that document, we constructed the following bar chart. Note that people who are Hispanic may be of any race, and people in each race group may be either Hispanic or not Hispanic.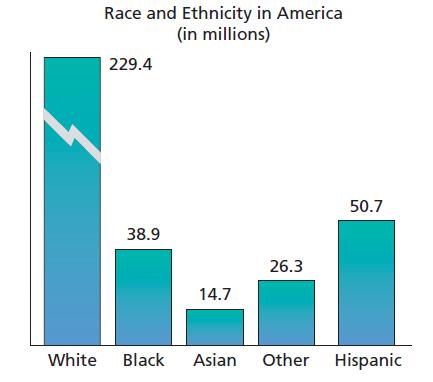
a. Explain why a break is shown in the first bar.
b. Why was the graph constructed with a broken bar?
c. Is this graph potentially misleading? Explain your answer.
Race and Ethnicity in America (in millions) 229.4 38.9 14.7 26.3 50.7 White Black Asian Other Hispanic
Step by Step Solution
3.44 Rating (160 Votes )
There are 3 Steps involved in it
a A break is shown in the first bar on the left to warn the reader that part of the first bar itself ... View full answer

Get step-by-step solutions from verified subject matter experts