

These data consist of the 503 daily returns for the calendar years 2005 and 2006 of the
Question:
These data consist of the 503 daily returns for the calendar years 2005 and 2006 of the S\&P value-weighted index. (The data file contains additional years - this exercise uses only 2005 and 2006 data.) Each year, there are about 250 days on which the exchange is open and stocks were traded on weekends and holidays it is closed. There are several indices to measure the market's overall performance. The value-weighted index is created by assuming that the amount invested in each stock is proportional to its market capitalization. Here, the market capitalization is simply the beginning price per share times the number of outstanding shares. An alternative is the equally weighted index, created by taking a simple average of the closing, or last, price of stocks that form the S\&P on that trading day. Financial economic theory states that if the market were predictable, many investors would attempt to take advantage of these predictions, thus forcing unpredictability. For example, suppose a statistical model reliably predicted mutual fund A to increase twofold over the next 18 months. Then, the no-arbitrage principle in financial economics states that several alert investors, armed with information from the statistical model, would bid to buy mutual fund \(\mathrm{A}\), thus causing the price to increase because demand is increasing. These alert investors would continue to purchase until the price of mutual fund A rose to the point where the return was equivalent to other investment opportunities in the same risk class. Thus, any advantages produced by the statistical model would disappear rapidly, thus eliminating this advantage.
Thus, financial economic theory states that for liquid markets such as stocks represented through the S\&P index there should be no detectable patterns, resulting in a white noise process. In practice, it has been found that the costs of buying and selling equities (called transactions costs) are great enough so as to prevent us from taking advantage of these slight tendencies in the swings of the market. This illustrates a point known as statistically significant but not practically important. This is not to suggest that statistics is not practical (heaven forbid!). Instead, statistics in and of itself does not explicitly recognize factors, such as economic, psychological, and so on, that may be extremely important in any given situation. It is up to the analyst to interpret the statistical analysis in light of these factors.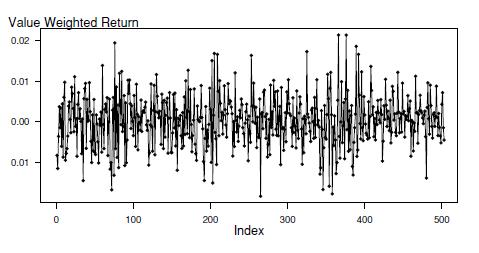
a. The time series plot in Figure 8.9 gives a preliminary idea of the characteristics of the sequence. Comment on the stationarity of the sequence. Figure 8.9 Time series plot of the \(S \& P\) daily market return, 2005-6.
b. Calculate summary statistics of the sequence. Suppose that you assume a white noise model for the the sequence. Compute one-, two-, and three-step-ahead forecasts for the daily returns for the first three trading days of 2007.
c. Calculate the autocorrelations for the lags 1 through 10. Do you detect any autocorrelations that are statistically significantly different from zero?
Step by Step Answer:
a Because the mean and variance of the sequence do not vary over tim...View the full answer


Regression Modeling With Actuarial And Financial Applications
ISBN: 9780521135962
1st Edition
Authors: Edward W. Frees
