

Question: . Plot the frequency response of the filter circuit shown in Figure 3. > Use AC sweep analysis and sweep frequency from 0Hz to
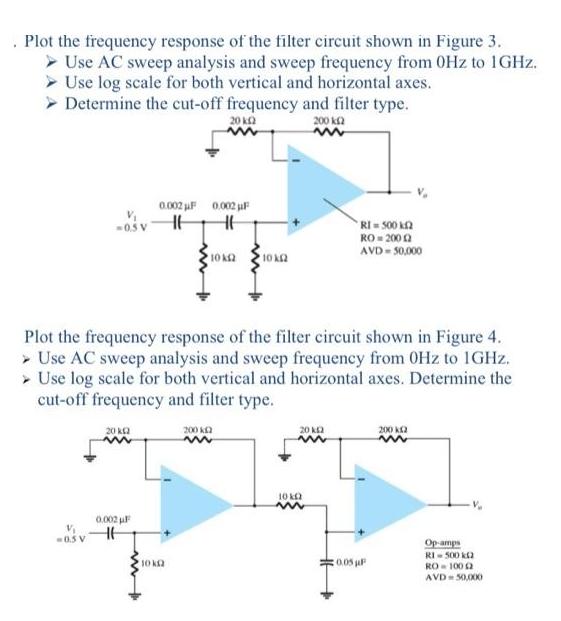
. Plot the frequency response of the filter circuit shown in Figure 3. > Use AC sweep analysis and sweep frequency from 0Hz to 1GHz. Use log scale for both vertical and horizontal axes. Determine the cut-off frequency and filter type. 20 k 2000 M -0.5 V V -0.5 V 20 k 0.002 F HE 0.002 F H 10 k Plot the frequency response of the filter circuit shown in Figure 4. > Use AC sweep analysis and sweep frequency from 0Hz to 1GHz. Use log scale for both vertical and horizontal axes. Determine the cut-off frequency and filter type. 0.002 F HE 200 k m 10k(2 10 k ena 10 k w 20 k RI= 500 K2 RO=20002 AVD-50,000 200 k m Op-amps RI-500 k RO 10002 AVD=50,000
Step by Step Solution
3.44 Rating (157 Votes )
There are 3 Steps involved in it
To solve the problem of plotting the frequency response of the filter circuit shown in figure 3 we c... View full answer

Get step-by-step solutions from verified subject matter experts