

Question: Data Set 1 ?Body Data? in Appendix B includes the heights of 147 randomly selected women, and heights of women are normally distributed. If you
Data Set 1 ?Body Data? in Appendix B includes the heights of 147 randomly selected women, and heights of women are normally distributed. If you were to construct a histogram of the 147 heights of women in Data Set 1, what shape do you expect the histogram to have? If you were to construct a normal quantile plot of those same heights, what pattern would you expect to see in the graph?
Data set 1
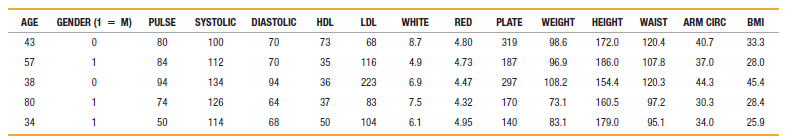
AGE GENDER (1 = M) PULSE DIASTOLIC HDL LDL RED PLATE HEIGHT ARM CIRC BMI SYSTOLIC 100 WHITE WEIGHT WAIST 172.0 43 80 70 73 68 8.7 4.80 319 98.6 120.4 40.7 33.3 57 186.0 84 112 70 35 116 4.9 4.73 187 96.9 107.8 37.0 28.0 154.4 38 94 134 94 36 223 6.9 4.47 297 108.2 120.3 44.3 45.4 80 74 126 37 83 7.5 4.32 170 73.1 160.5 97.2 30.3 28.4 64 179.0 50 114 50 104 6.1 4.95 83.1 95.1 34.0 25.9 34 68 140
Step by Step Solution
3.45 Rating (171 Votes )
There are 3 Steps involved in it
The histogram should be app... View full answer

Get step-by-step solutions from verified subject matter experts