

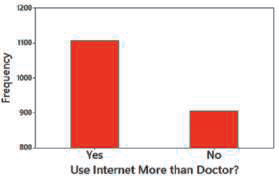
The accompanying graph was created to depict the results of the survey described in Exercise 1. Is
Question:
The accompanying graph was created to depict the results of the survey described in Exercise 1. Is the graph somehow misleading? If so, how?
Fantastic news! We've Found the answer you've been seeking!
Step by Step Answer:
The graph is misleading The vert...View the full answer

Answered By
Shaira grace
I have experience of more than ten years in handing academic tasks and assisting students to handle academic challenges. My level of education and expertise allows me communicate eloquently with clients and therefore understanding their nature and solving it successfully.
4+ Reviews
10+ Question Solved
Related Book For 
Question Posted:
