

Question: Construct a relative frequency histogram using the frequency distribution in Exercise 17. Then determine which class has the greatest relative frequency and which has the
Construct a relative frequency histogram using the frequency distribution in Exercise 17. Then determine which class has the greatest relative frequency and which has the least relative frequency.
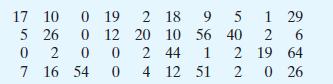
Use the data set, which represents the points scored by each player on the Montreal Canadiens in the 2015–2016 NHL season.
Data from Exercises 17
Construct a frequency distribution for the data set using eight classes. Include class limits, midpoints, boundaries, frequencies, relative frequencies, and cumulative frequencies.
7507 17 10 0 19 2 18 9 5 5 26 26 0 12 20 10 56 40 1 29 26 2 00 2 44 12 19 64 16 54 04 12 51 2 0 26
Step by Step Solution
3.41 Rating (157 Votes )
There are 3 Steps involved in it

Get step-by-step solutions from verified subject matter experts