

Question: Construct a relative frequency histogram using the frequency distribution in Exercise 1. Then determine which class has the greatest relative frequency and which has the
Construct a relative frequency histogram using the frequency distribution in Exercise 1. Then determine which class has the greatest relative frequency and which has the least relative frequency.
Use the data set, which represents the overall average class sizes for 20 national universities.
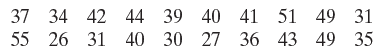
37 34 42 44 39 40 41 51 49 31 55 26 31 40 30 27 36 43 49 35
Step by Step Solution
★★★★★
3.37 Rating (175 Votes )
There are 3 Steps involved in it
1 Expert Approved Answer
Step: 1 Unlock

Class with greatest relative frequency ... View full answer
Question Has Been Solved by an Expert!
Get step-by-step solutions from verified subject matter experts
Step: 2 Unlock
Step: 3 Unlock