

The figure below shows the results of a survey in which 1000 adults were asked how much
Question:
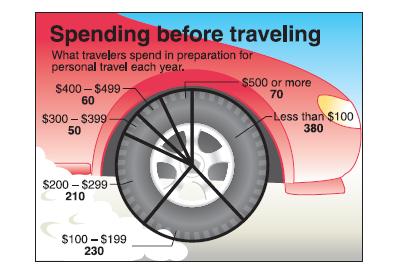
The figure below shows the results of a survey in which 1000 adults were asked how much they spend in preparation for personal travel each year. Make a frequency distribution for the data. Then use the table to estimate the sample mean and the sample standard deviation of the data set.
Fantastic news! We've Found the answer you've been seeking!
Step by Step Answer:

Answered By
Muhammad Rehan
Enjoy testing and can find bugs easily and help improve the product quality.
10+ Reviews
10+ Question Solved
Related Book For 

Elementary Statistics Picturing The World
ISBN: 9781292260464
7th Global Edition
Authors: Betsy Farber, Ron Larson
Question Posted:
