

The table shows the annual premiums for a random sample of home insurance policies in Connecticut, Massachusetts,
Question:
The table shows the annual premiums for a random sample of home insurance policies in Connecticut, Massachusetts, and Virginia. At \(\alpha=0.05\), can you conclude that the distribution of the annual premiums in at least one state is different from the others?
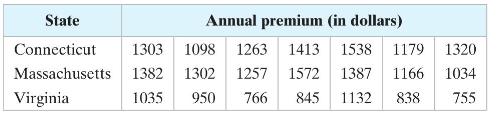
(a) identify the claim and state \(H_{0}\) and \(H_{a}\),
(b) find the critical value and identify the rejection region,
(c) find the test statistic \(H,\)
(d) decide whether to reject or fail to reject the null hypothesis,
(e) interpret the decision in the context of the original claim.
Fantastic news! We've Found the answer you've been seeking!
Step by Step Answer:

Answered By
Salmon ouma
I am a graduate of Maseno University, I graduated with a second class honors upper division in Business administration. I have assisted many students with their academic work during my years of tutoring. That has helped me build my experience as an academic writer. I am happy to tell you that many students have benefited from my work as a writer since my work is perfect, precise, and always submitted in due time. I am able to work under very minimal or no supervision at all and be able to beat deadlines.
I have high knowledge of essay writing skills. I am also well conversant with formatting styles such as Harvard, APA, MLA, and Chicago. All that combined with my knowledge in methods of data analysis such as regression analysis, hypothesis analysis, inductive approach, and deductive approach have enabled me to assist several college and university students across the world with their academic work such as essays, thesis writing, term paper, research project, and dissertation. I have managed to help students get their work done in good time due to my dedication to writing.
4+ Reviews
16+ Question Solved
Related Book For 

Elementary Statistics Picturing The World
ISBN: 9781292260464
7th Global Edition
Authors: Betsy Farber, Ron Larson
Question Posted:
