

Tourism Use a time series chart to display the data shown in the table. The data represent
Question:
Tourism Use a time series chart to display the data shown in the table. The data represent the percentages of Egypt’s gross domestic product (GDP) that come from the travel and tourism sector.
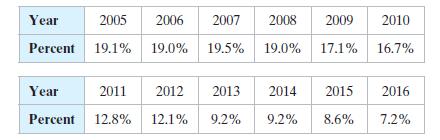
Organize the data using the indicated type of graph. Describe any patterns.
Step by Step Answer:

This question has not been answered yet.
You can Ask your question!
Related Book For 

Elementary Statistics Picturing The World
ISBN: 9781292260464
7th Global Edition
Authors: Betsy Farber, Ron Larson
Question Posted:
