

Question: Use a time series chart to display the data shown in the table. The data represent the percentages of the U.S. gross domestic product (GDP)
Use a time series chart to display the data shown in the table. The data represent the percentages of the U.S. gross domestic product (GDP) that come from the construction sector.
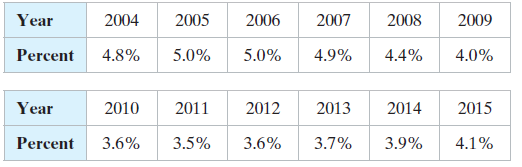
Organize the data using the indicated type of graph. Describe any patterns.
Year 2005 2007 2009 2004 2006 2008 Percent 4.0% 4.8% 5.0% 5.0% 4.9% 4.4% Year 2010 2011 2012 2013 2014 2015 3.5% Percent 4.1% 3.6% 3.6% 3.7% 3.9%
Step by Step Solution
★★★★★
3.41 Rating (157 Votes )
There are 3 Steps involved in it
1 Expert Approved Answer
Step: 1 Unlock

Let the horizontal axis represent the years and let the vertical axis re... View full answer
Question Has Been Solved by an Expert!
Get step-by-step solutions from verified subject matter experts
Step: 2 Unlock
Step: 3 Unlock