

Question: Use a stem-and-leaf plot that has two rows for each stem to display the data, which represent the incomes (in millions) of the top 30
Use a stem-and-leaf plot that has two rows for each stem to display the data, which represent the incomes (in millions) of the top 30 highest-paid tech CEOs.
Organize the data using the indicated type of graph. Describe any patterns.
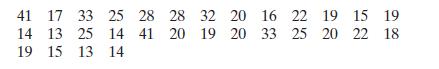
41 17 33 25 28 28 32 20 16 22 19 15 19 14 13 25 14 19 15 13 14 41 20 19 20 33 25 20 22 18
Step by Step Solution
There are 3 Steps involved in it
1 Expert Approved Answer
Step: 1 Unlock

Most of the hig... View full answer
Question Has Been Solved by an Expert!
Get step-by-step solutions from verified subject matter experts
Step: 2 Unlock
Step: 3 Unlock