

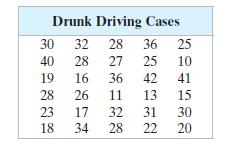
Question: Use a stem-and-leaf plot to display the data shown in the table at the left, which represent the drunk driving cases registered at 30 strategic
Use a stem-and-leaf plot to display the data shown in the table at the left, which represent the drunk driving cases registered at 30 strategic road intersections.
Organize the data using the indicated type of graph. Describe any patterns.
Drunk Driving Cases 30 32 28 36 25 40 28 27 25 10 19 16 36 42 41 28 26 11 13 15 23 17 32 31 30 18 34 28 22 20
Step by Step Solution
★★★★★
3.39 Rating (155 Votes )
There are 3 Steps involved in it
1 Expert Approved Answer
Step: 1 Unlock

Question Has Been Solved by an Expert!
Get step-by-step solutions from verified subject matter experts
Step: 2 Unlock
Step: 3 Unlock