

Question: Use the histogram and normal probability plot to determine whether the data come from a normal distribution. Explain your reasoning. Frequency 25 20 20 15
Use the histogram and normal probability plot to determine whether the data come from a normal distribution.
Explain your reasoning.
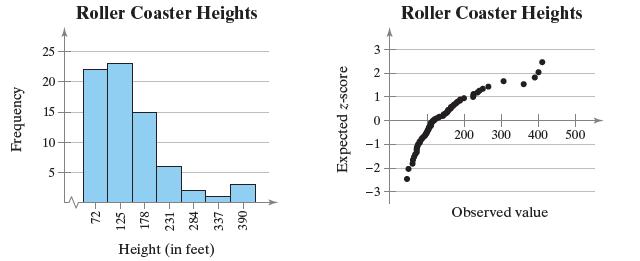
Frequency 25 20 20 15 10 5 Roller Coaster Heights Height (in feet) Expected z-score 3 2 7 2 1 Roller Coaster Heights 200 300 400 500 Observed value
Step by Step Solution
★★★★★
3.31 Rating (160 Votes )
There are 3 Steps involved in it
1 Expert Approved Answer
Step: 1 Unlock

Because the points appear to ... View full answer
Question Has Been Solved by an Expert!
Get step-by-step solutions from verified subject matter experts
Step: 2 Unlock
Step: 3 Unlock