

Question: Use the histogram and normal probability plot to determine whether the data come from a normal distribution. Explain your reasoning. Relative frequency 0.25 0.20 0.15
Use the histogram and normal probability plot to determine whether the data come from a normal distribution.
Explain your reasoning.
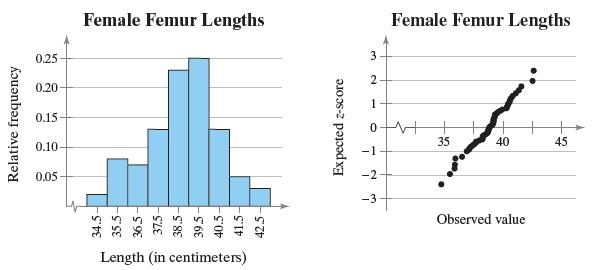
Relative frequency 0.25 0.20 0.15 0.10 0.05 34.5- 35.5- 36.5- 37.5- 38.5- 39.5- Female Femur Lengths 40.5- Length (in centimeters) 41.5- 42.5 Expected z-score -1 -2 -3 0 3 2 1 Female Femur Lengths + + 35 40 45 Observed value
Step by Step Solution
★★★★★
3.47 Rating (150 Votes )
There are 3 Steps involved in it
1 Expert Approved Answer
Step: 1 Unlock

Question Has Been Solved by an Expert!
Get step-by-step solutions from verified subject matter experts
Step: 2 Unlock
Step: 3 Unlock