

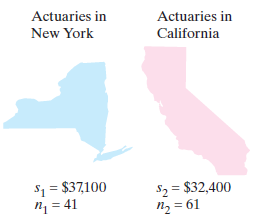
An employment information service claims that the standard deviation of the annual salaries for actuaries is less
Question:
An employment information service claims that the standard deviation of the annual salaries for actuaries is less in California than in New York. You select a sample of actuaries from each state. The results of each survey are shown in the figure. At α = 0.05, can you support the service’s claim?
(a) Identify the claim and state H0 and Ha,
(b) Find the critical value and identify the rejection region,
(c) Find the test statistic F,
(d) Decide whether to reject or fail to reject the null hypothesis, and
(e) Interpret the decision in the context of the original claim. Assume the samples are random and independent, and the populations are normally distributed.
Fantastic news! We've Found the answer you've been seeking!
Step by Step Answer:
Population 1 New York Population 2 California a The claim is the standard devia...View the full answer

Answered By
William Otieno
I am a professional tutor and a writer with excellent skills that are important in serving the bloggers and other specialties that requires a great writer. The important aspects of being the best are that I have served so many clients with excellence
With excellent skills, I have acquired very many recommendations which have made it possible for me to survive as an excellent and cherished writer. Being an excellent content writer am also a reputable IT writer with essential skills that can make one turn papers into excellent result.
83+ Reviews
354+ Question Solved
Related Book For 

Elementary Statistics Picturing The World
ISBN: 9780134683416
7th Edition
Authors: Ron Larson, Betsy Farber
Question Posted:
