

The table at the left shows a sample of the waiting times (in days) for a heart
Question:
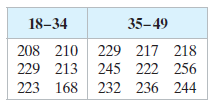
The table at the left shows a sample of the waiting times (in days) for a heart transplant for two age groups. At a = 0.05, can you conclude that the variances of the waiting times differ between the two age groups?
(a) Identify the claim and state H0 and Ha,
(b) Find the critical value and identify the rejection region,
(c) Find the test statistic F,
(d) Decide whether to reject or fail to reject the null hypothesis, and
(e) Interpret the decision in the context of the original claim. Assume the samples are random and independent, and the populations are normally distributed.
Fantastic news! We've Found the answer you've been seeking!
Step by Step Answer:
Population 1 Age group 3549 Population 2 Age group 1834 a The claim i...View the full answer

Answered By
Saikumar Ramagiri
Financial accounting:- Journal and ledgers, preparation of trail balance and adjusted trail balance Preparation of income statement, retained earning statement and balance sheet Banks reconciliation statements Financial statement analysis Cash flow statement analysis (both direct and indirect methods) All methods of Depreciations Management Accounting:- Ratios Budgeting control Cash budget and production budget Working capital management Receivable management Costing:- Standard and variance costing Marginal costing and decision making Cost-volume-profit analysis Inventory management (LIFO, FIFO) Preparation and estimation of cost sheet Portfolio management:- Calculation of portfolio standard deviation or risk Calculation of portfolio expected returns CAPM, Beta Financial management:- Time value of money Capital budgeting Cost of capital Leverage analysis and capital structure policies Dividend policy Bond value calculations like YTM, current yield etc International finance:- Derivatives Futures and options Swaps and forwards Business problems Finance problems Education (mention all your degrees, year awarded, Institute/University, field(s) of major): Education Qualification Board/Institution/ University Month/Year of Passing % Secured OPTIONALS/ Major ICWAI(inter) ICWAI inter Pursuing Pursuing - M.com(Finance) Osmania University June 2007 65 Finance & Taxation M B A (Finance) Osmania University Dec 2004 66 Finance & Marketing. B.Com Osmania University June 2002 72 Income Tax, Cost & Mgt, Accountancy, Auditing. Intermediate (XII) Board of Intermediate May 1999 58 Mathematics, Accountancy, Economics. S S C (X) S S C Board. May 1997 74 Mathematics, Social Studies, Science. Tutoring experience: • 10 year experience in online trouble shooting problems related to finance/accountancy. • Since 6 Years working with solution inn as a tutor, I have solved thousands of questions, quick and accuracy Skills (optional): Technical Exposure: MS Office, SQL, Tally, Wings, Focus, Programming with C Financial : Portfolio/Financial Management, Ratio Analysis, Capital Budgeting Stock Valuation & Dividend Policy, Bond Valuations Individual Skills : Proactive Nature, Self Motivative, Clear thought process, Quick problem solving skills, flexible to complex situations. Achievements : 1. I have received an Award certificate from Local Area MLA for the cause of getting 100% marks in Accountancy during my Graduation. 2. I have received a GOLD MEDAL/Scholarship from Home Minister in my MBA for being the “Top Rank student “ of management institute. 3. I received numerous complements and extra pay from various students for trouble shooting their online problems. Other interests/Hobbies (optional): ? Web Surfing ? Sports ? Watching Comics, News channels ? Miniature Collection ? Exploring hidden facts ? Solving riddles and puzzles
391+ Reviews
552+ Question Solved
Related Book For 

Elementary Statistics Picturing The World
ISBN: 9780134683416
7th Edition
Authors: Ron Larson, Betsy Farber
Question Posted:
