

Compare your results in Exercise 45 with the equation of the regression line and its graph. Which
Question:
Compare your results in Exercise 45 with the equation of the regression line and its graph. Which equation is a better model for the data? Explain.
The logarithmic equation is a nonlinear regression equation of the form y = a + b lnx. Use this information and technology.
Data from Exercise 45:
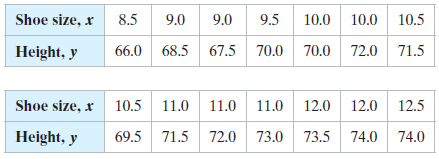
Find and graph the logarithmic equation for the data in Exercise 25.
The logarithmic equation is a nonlinear regression equation of the form y = a + b lnx. Use this information and technology.
Data from Exercise 25:
The shoe sizes and heights (in inches) of 14 men
Fantastic news! We've Found the answer you've been seeking!
Step by Step Answer:
The logarithmic equation is ...View the full answer

Answered By
PALASH JHANWAR
I am a Chartered Accountant with AIR 45 in CA - IPCC. I am a Merit Holder ( B.Com ). The following is my educational details.
PLEASE ACCESS MY RESUME FROM THE FOLLOWING LINK: https://drive.google.com/file/d/1hYR1uch-ff6MRC_cDB07K6VqY9kQ3SFL/view?usp=sharing
3+ Reviews
10+ Question Solved
Related Book For 

Elementary Statistics Picturing The World
ISBN: 9780134683416
7th Edition
Authors: Ron Larson, Betsy Farber
Question Posted:
