

Question: Find and graph the logarithmic equation for the data in Exercise 26. The logarithmic equation is a nonlinear regression equation of the form y =
Find and graph the logarithmic equation for the data in Exercise 26.
The logarithmic equation is a nonlinear regression equation of the form y = a + b lnx. Use this information and technology.
Data from Exercise 26:
The ages (in years) of 10 infants and the numbers of hours each slept in a day
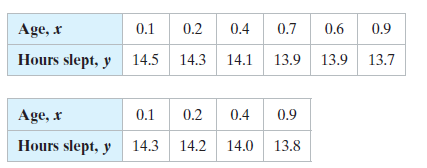
Age, r Hours slept, y 14.5 0.2 0.1 0.4 0.7 0.6 0.9 13.7 14.3 14.1 13.9 13.9 0.1 Age, r Hours slept, y 0.2 0.4 0.9 14.3 14.2 13.8 14.0
Step by Step Solution
★★★★★
3.42 Rating (165 Votes )
There are 3 Steps involved in it
1 Expert Approved Answer
Step: 1 Unlock

y 137... View full answer
Question Has Been Solved by an Expert!
Get step-by-step solutions from verified subject matter experts
Step: 2 Unlock
Step: 3 Unlock