

Question: Construct a frequency distribution and a frequency histogram for the data set using the indicated number of classes. Describe any patterns. Finishing Times Number of
Construct a frequency distribution and a frequency histogram for the data set using the indicated number of classes. Describe any patterns.
Finishing Times
Number of classes: 8
Data set: Finishing times (in seconds) of 21 participants in a 10K race.
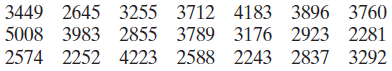
3449 2645 3255 3712 4183 3896 3760 5008 3983 2855 3789 3176 2923 2281 2574 2252 4223 2588 2243 2837 3292
Step by Step Solution
★★★★★
3.41 Rating (179 Votes )
There are 3 Steps involved in it
1 Expert Approved Answer
Step: 1 Unlock

Sample answer The graph shows that the most frequent finishing times were from 2243 to ... View full answer
Question Has Been Solved by an Expert!
Get step-by-step solutions from verified subject matter experts
Step: 2 Unlock
Step: 3 Unlock