

Question: Construct a run chart for the 130 values. Does there appear to be a pattern suggesting that the process is not within statistical control? What
Construct a run chart for the 130 values. Does there appear to be a pattern suggesting that the process is not within statistical control? What are the practical implications of the run chart?
Use the data in the following table, which lists carbon dioxide concentrations (in parts per million) for each year from 1880 to 2009, with projected values used for the last four years. Atmospheric carbon dioxide is believed to be the result of human activity and a major contributor to the greenhouse effect that is at least partly responsible for global warming.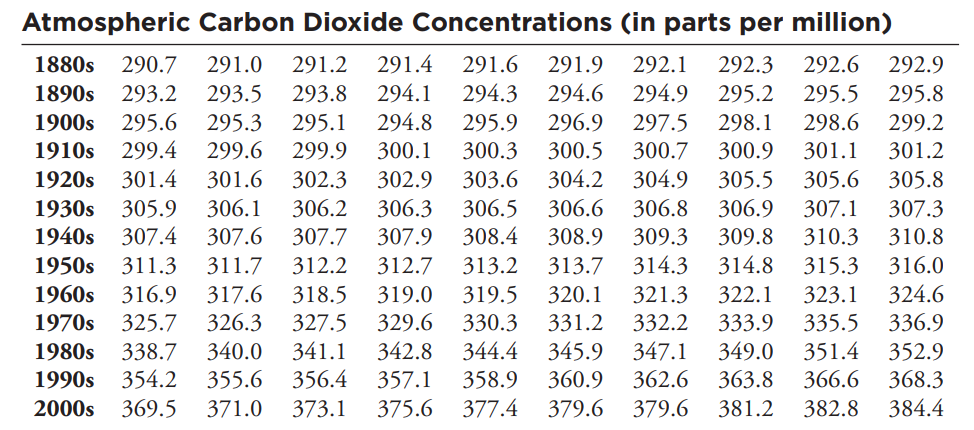
Atmospheric Carbon Dioxide Concentrations (in parts per million) 1880s 290.7 291.0 291.2 291.4 291.6 291.9 292.1 292.3 292.6 292.9 1890s 293.2 293.5 293.8 294.1 294.3 294.6 294.9 295.2 295.5 295.8 294.8 298.6 295.6 299.4 1900s 295.3 295.1 295.9 296.9 297.5 298.1 299.2 1910s 299.6 299.9 300.1 300.3 300.5 300.7 300.9 301.1 301.2 1920s 301.4 301.6 302.3 302.9 303.6 304.2 304.9 305.5 305.6 305.8 1930s 306.1 306.2 306.3 306.5 306.6 306.8 306.9 305.9 307.4 307.1 307.3 1940s 307.6 307.7 307.9 308.4 308.9 309.3 309.8 310.3 310.8 1950s 311.3 311.7 312.2 312.7 313.2 313.7 314.3 314.8 315.3 316.0 1960s 316.9 317.6 318.5 319.0 319.5 320.1 321.3 322.1 323.1 324.6 326.3 329.6 342.8 1970s 325.7 327.5 330.3 331.2 332.2 333.9 335.5 336.9 340.0 355.6 344.4 345.9 360.9 347.1 341.1 356.4 1980s 338.7 349.0 351.4 352.9 1990s 354.2 358.9 362.6 363.8 366.6 368.3 384.4 357.1 2000s 369.5 371.0 373.1 375.6 377.4 379.6 379.6 381.2 382.8
Step by Step Solution
3.44 Rating (167 Votes )
There are 3 Steps involved in it
To construct a run chart we will plot the carbon dioxide concentrations over time and analyze any pa... View full answer

Get step-by-step solutions from verified subject matter experts