

Question: Display the data below in a stem-and-leaf plot. Describe the differences in how the dot plot and the stem-and-leaf plot show patterns in the data.
Display the data below in a stem-and-leaf plot. Describe the differences in how the dot plot and the stem-and-leaf plot show patterns in the data.
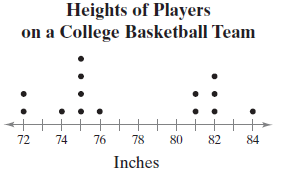
Heights of Players on a College Basketball Team 72 74 76 78 80 82 84 Inches
Step by Step Solution
★★★★★
3.41 Rating (157 Votes )
There are 3 Steps involved in it
1 Expert Approved Answer
Step: 1 Unlock

The dot plot helps you see that the data are c... View full answer
Question Has Been Solved by an Expert!
Get step-by-step solutions from verified subject matter experts
Step: 2 Unlock
Step: 3 Unlock