

Question: Figure 7-6 and Table 7-1 summarize the decisions made when choosing between the normal and t distributions. An alternative method included in some textbooks (but
Figure 7-6 and Table 7-1 summarize the decisions made when choosing between the normal and t distributions. An alternative method included in some textbooks (but almost never used by professional statisticians and almost never included in professional journals) is based on this criterion: Substitute the sample standard deviation s for ? whenever n > 30, then proceed as if ? is known. Using this alternative method, repeat Exercise 30. Compare the results to those found in Exercise 30, and comment on the implications of the change in the width of the confidence interval.
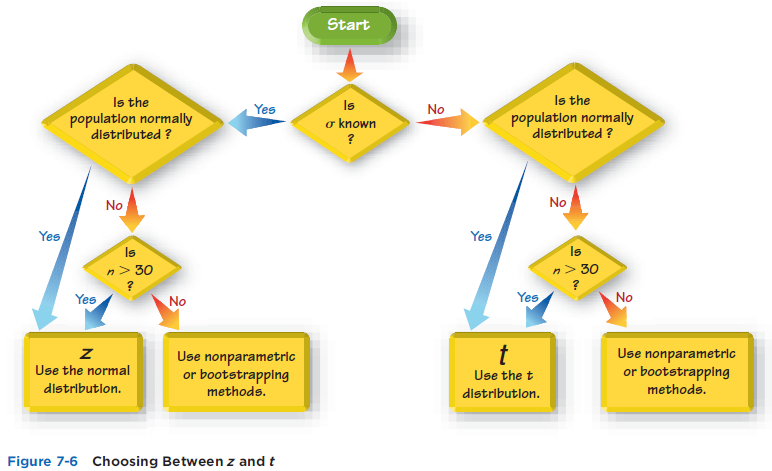
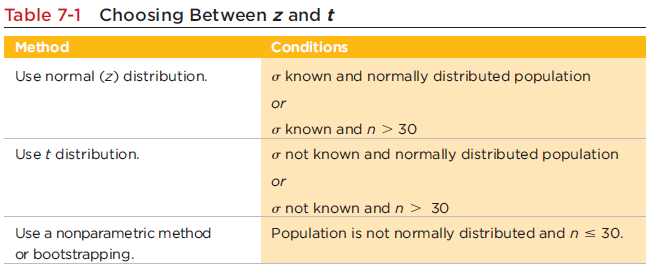
Yes Is the population normally distributed ? Yes No Is 30 ? Z Use the normal distribution. No Yes Use nonparametric or bootstrapping methods. Figure 7-6 Choosing Between z and t Start Is known ? No Yes Is the population normally distributed ? Yes t Use the t distribution. No Is n> 30 ? No Use nonparametric or bootstrapping methods. Table 7-1 Choosing Between z and t Conditions o known and normally distributed population or o known and n > 30 o not known and normally distributed population or o not known and n > 30 Population is not normally distributed and n 30. Method Use normal (z) distribution. Use t distribution. Use a nonparametric method or bootstrapping.
Step by Step Solution
3.48 Rating (165 Votes )
There are 3 Steps involved in it
Solution The comparison of the results is that using s gives more conservati... View full answer

Get step-by-step solutions from verified subject matter experts