

If we use subgroups of size corresponding to the rows of the table, and if we use
Question:
If we use subgroups of size corresponding to the rows of the table, and if we use all of the data from 25 days of production, we get the R chart shown below. Interpret that R chart.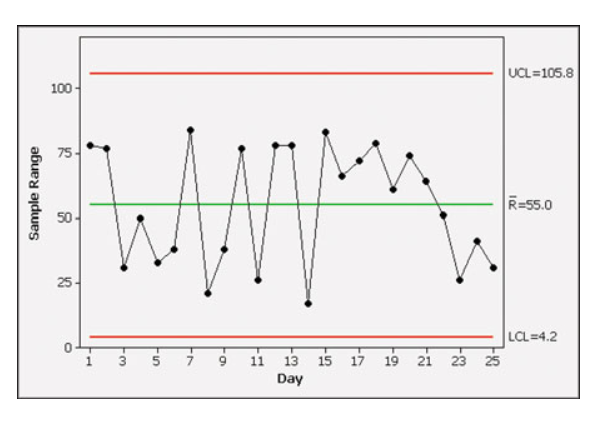
Fantastic news! We've Found the answer you've been seeking!
Step by Step Answer:
The center line for the R chart represents the process variatio...View the full answer

Answered By
Maruti Shinde
I completed my post graduation in Statistics from Solapur University Solapur, Maharashtra. l have technical skills such as R software, Minitab, Ms-excel which are useful to solve statistical problems.
l had participated in National conference on Statistics in social science research. I completed WordsMaya's advanced technical communication course.
I tutored mostly High school students privately after college and during the summer.
0 Reviews
10+ Question Solved
Related Book For 

Question Posted:
