

Question: In Exercise 15, use technology to perform the hypothesis test with a P-value. Compare your result with the result obtained using rejection regions. Are they
In Exercise 15, use technology to perform the hypothesis test with a P-value. Compare your result with the result obtained using rejection regions. Are they the same?
Data from Exercise 15:
A college administrator suggests that student housing rates have increased from one academic year to the next. The table shows the rates (in dollars per academic year) for 12 student housing arrangement options in two consecutive academic years. At α = 0.05, is there enough evidence to support the college administrator’s claim?
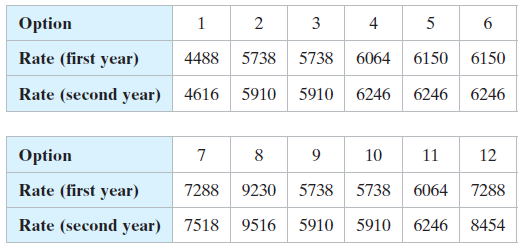
2 3 Option 4 5 Rate (first year) 6150 4488 5738 5738 6064 6150 Rate (second year) 4616 5910 5910 6246 6246 6246 Option 10 11 12 Rate (first year) 7288 9230 5738 5738 6064 7288 Rate (second year) 8454 7518 9516 5910 5910 6246
Step by Step Solution
3.45 Rating (152 Votes )
There are 3 Steps involved in it
Yes P 0... View full answer

Get step-by-step solutions from verified subject matter experts