

Question: Listed below are head injury data from crash test dummies used in the same cars from the Chapter Problem. These measurements are in hic, which
Listed below are head injury data from crash test dummies used in the same cars from the Chapter Problem. These measurements are in hic, which denotes a standard head injury criterion. Use a 0.05 significance level to test the null hypothesis that the different car categories have the same mean. Do these data suggest that larger cars are safer?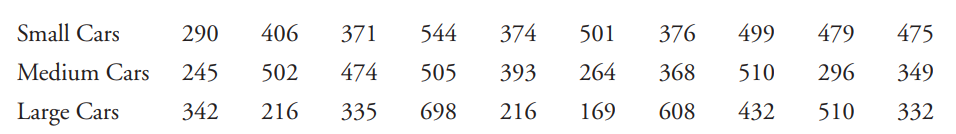
Small Cars Medium Cars Large Cars 290 406 371 245 502 474 342 216 335 544 374 501 376 499 479 505 393 264 368 510 698 216 169 608 432 475 296 349 510 332
Step by Step Solution
3.36 Rating (152 Votes )
There are 3 Steps involved in it
They suggest that larger cars are safer Fishers exact test is an extensio... View full answer

Get step-by-step solutions from verified subject matter experts