

Question: Minitab is used to construct a histogram of the weights of a simple random sample of M&M candies, and the result is shown on the
Minitab is used to construct a histogram of the weights of a simple random sample of M&M candies, and the result is shown on the next page.
a. Does the sample appear to be from a population with a normal distribution?
b. How many sample values are represented in the histogram?
c. What is the class width used in the histogram?
d. Use the histogram to estimate the mean weight.
e. Can the histogram be used to identify the exact values in the original list of sample data?
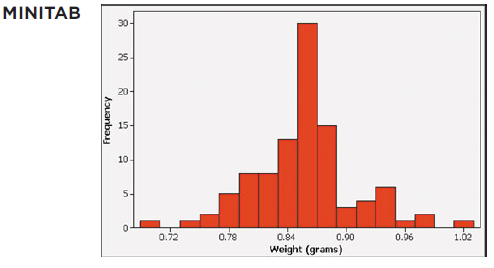
MINITAB Frequency 30- 25- 20- 15- 10- 5- O 31 0.72 0.78 0.90 0.84 Weight (grams) 0.96 1.02
Step by Step Solution
3.43 Rating (156 Votes )
There are 3 Steps involved in it
a No the sample does not appear to be from a population with a normal distribution b Ther... View full answer

Get step-by-step solutions from verified subject matter experts