

Question: Refer to Data Set 13 in Appendix B and use the 40 home voltage measurements. Construct a frequency distribution with five classes. Begin with a
Refer to Data Set 13 in Appendix B and use the 40 home voltage measurements. Construct a frequency distribution with five classes. Begin with a lower class limit of 123.3 volts, and use a class width of 0.20 volt. Does the result appear to have a normal distribution? Why or why not?
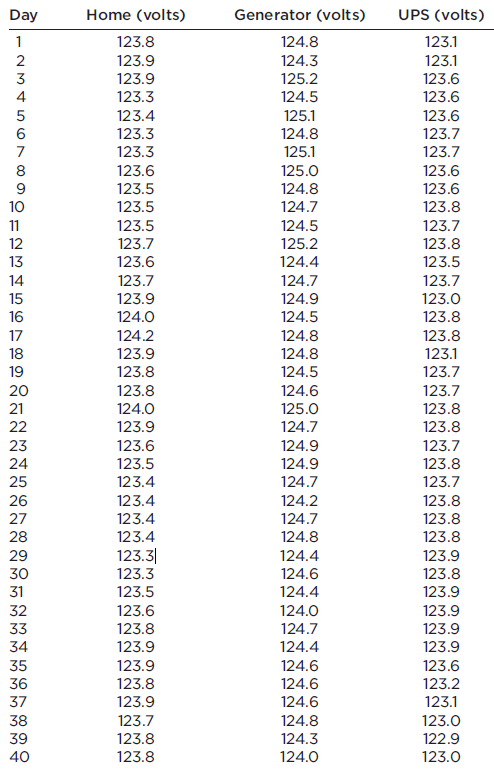
Day Home (volts) Generator (volts) UPS (volts) 123.8 124.8 123.1 2 123.9 124.3 123.1 123.9 125.2 123.6 4 123.3 124.5 123.6 123.4 125.1 123.6 123.3 124.8 123.7 123.3 123.7 125.1 125.0 124.8 123.6 123.6 123.5 123.6 10 123.5 124.7 123.8 124.5 125.2 124.4 11 123.5 123.7 123.7 123.8 12 13 123.6 123.5 14 123.7 124.7 123.7 15 123.9 124.9 123.0 16 124.0 124.5 123.8 124.8 123.8 123.1 17 124.2 18 123.9 124.8 19 123.8 124.5 123.7 20 123.8 124.6 123.7 21 124.0 125.0 123.8 22 123.9 124.7 123.8 23 123.6 124.9 123.7 24 123.5 124.9 123.8 25 123.4 124.7 123.7 26 123.4 124.2 123.8 27 123.4 124.7 123.8 28 123.4 124.8 123.8 123.3| 123.3 123.5 123.6 123.8 29 124.4 123.9 30 124.6 123.8 31 124.4 123.9 32 124.0 123.9 33 124.7 123.9 123.9 34 123.9 124.4 35 123.9 124.6 123.6 36 123.8 124.6 123.2 37 123.9 124.6 123.1 38 123.7 124.8 123.0 122.9 123.8 124.3 124.0 39 40 123.8 123.0
Step by Step Solution
3.44 Rating (179 Votes )
There are 3 Steps involved in it
Below we constructed the frequency distribution of home voltage meas... View full answer

Get step-by-step solutions from verified subject matter experts
Document Format (2 attachments)
1545_605d88e2141c4_818127.pdf
180 KBs PDF File
1545_605d88e2141c4_818127.docx
120 KBs Word File