

Question: Refer to Data Set 18 in Appendix B and find the sample proportion of M&Ms that are green. Use that result to construct a 95%
Refer to Data Set 18 in Appendix B and find the sample proportion of M&Ms that are green. Use that result to construct a 95% confidence interval estimate of the population percentage of M&Ms that are green. Is the result consistent with the 16% rate that is reported by the candy maker Mars? Why or why not?
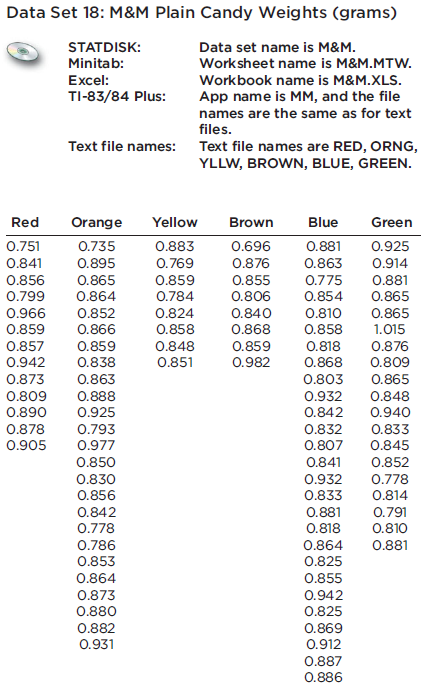
Data Set 18: M&M Plain Candy Weights (grams) STATDISK: Minitab: Excel: Data set name is M&M. Worksheet name is M&M.MTW. Workbook name is M&M.XLS. App name is MM, and the file names are the same as for text files. TI-83/84 Plus: Text file names are RED, ORNG, YLLW, BROWN, BLUE, GREEN. Text file names: Red Orange Yellow 0.751 0.735 0.841 0.895 0.856 0.865 0.799 0.864 0.966 0.852 0.859 0.866 0.857 0.859 0.942 0.838 0.873 0.863 0.809 0.888 0.890 0.925 0.878 0.793 0.905 0.977 0.850 0.830 0.856 0.842 0.778 0.786 0.853 Brown Blue 0.883 0.696 0.881 0.769 0.876 0.863 0.859 0.855 0.775 0.784 0.806 0.854 0.824 0.840 0.858 0.868 0.859 0.982 0.864 0.873 0.880 0.882 0.931 0.848 0.851 0.810 0.858 0.818 0.868 0.803 0.932 0.842 0.832 0.807 0.841 0.932 0.833 0.881 0.818 0.864 0.825 0.855 0.942 0.825 0.869 0.912 0.887 0.886 Green 0.925 0.914 0.881 0.865 0.865 1.015 0.876 0.809 0.865 0.848 0.940 0.833 0.845 0.852 0.778 0.814 0.791 0.810 0.881
Step by Step Solution
3.37 Rating (156 Votes )
There are 3 Steps involved in it
ANSWER The sample proportion of MMs that are green is 013 13 The 95 confidence interval estimate ... View full answer

Get step-by-step solutions from verified subject matter experts