

Question: Refer to Data Set 3 in Appendix B. a. Based on the sample results, find the best point estimate of the percentage of college students
Refer to Data Set 3 in Appendix B.
a. Based on the sample results, find the best point estimate of the percentage of college students who gain weight in their freshman year.
b. Construct a 95% confidence interval estimate of the percentage of college students who gain weight in their freshman year.
c. Assuming that you are a newspaper reporter, write a statement that describes the results. Include all of the relevant information.
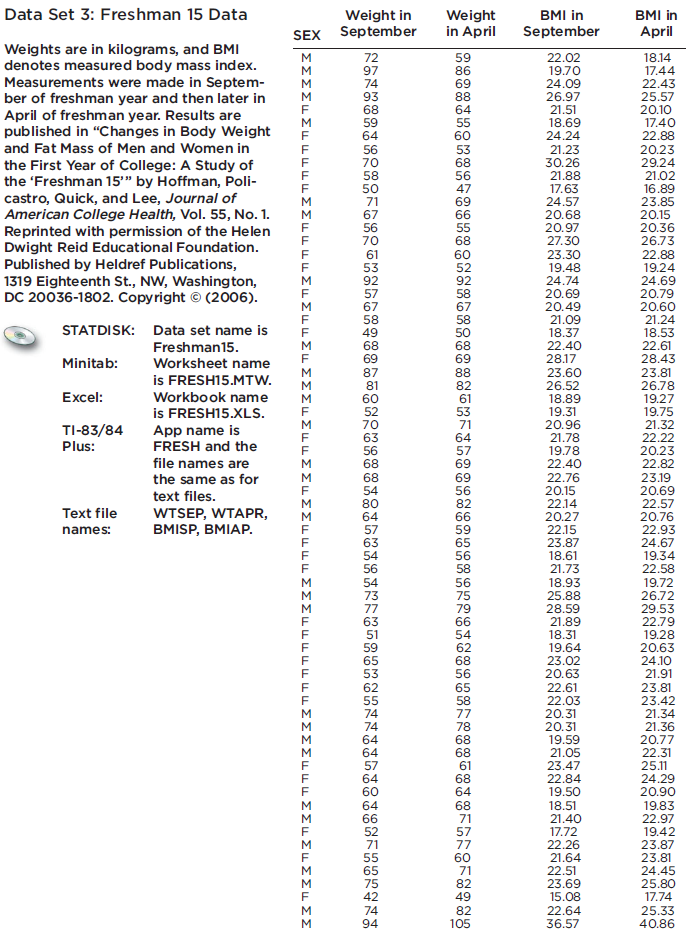
Data Set 3: Freshman 15 Data Weights are in kilograms, and BMI denotes measured body mass index. Measurements were made in Septem- ber of freshman year and then later in April of freshman year. Results are published in "Changes in Body Weight and Fat Mass of Men and Women in the First Year of College: A Study of the 'Freshman 15"" by Hoffman, Poli- castro, Quick, and Lee, Journal of American College Health, Vol. 55, No. 1. Reprinted with permission of the Helen Dwight Reid Educational Foundation. Published by Heldref Publications, 1319 Eighteenth St., NW, Washington, DC 20036-1802. Copyright (2006). STATDISK: Data set name is Freshman15. Worksheet name Minitab: Excel: TI-83/84 Plus: Text file names: is FRESH15.MTW. Workbook name is FRESH15.XLS. App name is FRESH and the file names are the same as for text files. WTSEP, WTAPR, BMISP, BMIAP. Weight in SEX September uuuuuuuuusu Suu u uuuuuuuuuuuuuu NAMORARFRundhOOFKANT M M 72 97 74 93 68 59 64 56 70 58 50 71 67 56 70 53 92 57 58 49 60 52 70 63 56 68 68 54 57 63 54 56 54 77 63 51 65 53 62 55 74 74 64 64 57 64 60 52 71 55 65 75 42 74 94 Weight in April 59 86 69 88 64 55 60 53 68 56 47 69 66 55 68 60 52 92 58 67 58 50 68 69 88 82 61 53 71 64 57 69 69 56 82 66 59 65 56 58 95659646268565878868-84877760782 49 82 105 61 71 71 BMI in September 22.02 19.70 24.09 26.97 21.51 18.69 24.24 21.23 30.26 21.88 17.63 24.57 20.68 20.97 27.30 23.30 19.48 24.74 20.69 20.49 21.09 18.37 22.40 28.17 23.60 26.52 18.89 19.31 20.96 21.78 19.78 22.40 22.76 20.15 22.14 20.27 22.15 23.87 18.61 21.73 18.93 25.88 28.59 21.89 18.31 19.64 23.02 20.63 22.61 22.03 20.31 20.31 19.59 21.05 23.47 22.84 19.50 18.51 21.40 17.72 22.26 21.64 22.51 23.69 15.08 22.64 36.57 BMI in April 18.14 17.44 22.43 25.57 20.10 17.40 22.88 20.23 29.24 21.02 16.89 23.85 20.15 20.36 26.73 22.88 19.24 24.69 20.79 20.60 21.24 18.53 22.61 28.43 23.81 26.78 19.27 19.75 21.32 22.22 20.23 22.82 23.19 20.69 22.57 20.76 22.93 24.67 19.34 22.58 19.72 26.72 29.53 22.79 19.28 20.63 24.10 21.91 23.81 23.42 21.34 21.36 20.77 22.31 25.11 24.29 20.90 19.83 22.97 19.42 23.87 23.81 24.45 25.80 17.74 25.33 40.86
Step by Step Solution
3.38 Rating (167 Votes )
There are 3 Steps involved in it
Answer a The best point estimate of the percentage of college students who gain weight in t... View full answer

Get step-by-step solutions from verified subject matter experts