

Question: Refer to the sample data in Table 4-1. a. How many responses were actually lies? b. If one of the responses is randomly selected, what
Refer to the sample data in Table 4-1.
a. How many responses were actually lies?
b. If one of the responses is randomly selected, what is the probability that it is a lie? (Express the answer as a fraction.)
c. Use the rounding method described in this section to express the answer from part (b) as a decimal.
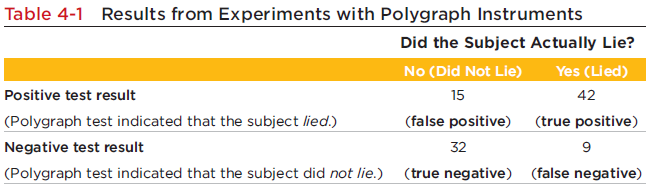
Table 4-1 Results from Experiments with Polygraph Instruments Did the Subject Actually Lie? No (Did Not Lie) Yes (Lied) Positive test result 15 42 (Polygraph test indicated that the subject lied.) (false positive) (true positive) Negative test result 32 9 (Polygraph test indicated that the subject did not lie.) (true negative) (false negative)
Step by Step Solution
3.33 Rating (156 Votes )
There are 3 Steps involved in it
The known data are shown in the table No Did not lie Yes Lied Posi... View full answer

Get step-by-step solutions from verified subject matter experts
Document Format (2 attachments)
1545_605d88e23640a_860617.pdf
180 KBs PDF File
1545_605d88e23640a_860617.docx
120 KBs Word File