

See the accompanying graph illustrating the acceleration times (in seconds) of four different cars. The actual acceleration
Question:
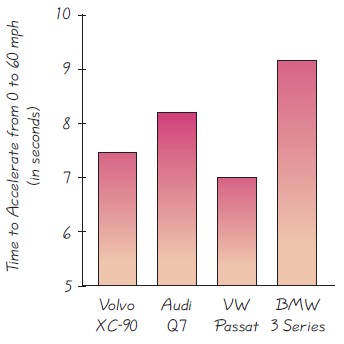
See the accompanying graph illustrating the acceleration times (in seconds) of four different cars. The actual acceleration times are as follows: Volvo XC-90: 7.6 s; Audi Q7: 8.2 s; Volkswagon Passat: 7.0 s; BMW 3 Series: 9.2 s. Does the graph correctly illustrate the acceleration times, or is it somehow misleading? Explain. If the graph is misleading, draw a graph that correctly illustrates the acceleration times.
Fantastic news! We've Found the answer you've been seeking!
Step by Step Answer:
The graph is misleading The diffe...View the full answer

Answered By
Allan Olal
I have vast tutoring experience of more than 8 years and my primary objective as a tutor is to ensure that a student achieves their academic goals.
78+ Reviews
409+ Question Solved
Related Book For 

Question Posted:
