

Question: Shown below is a Minitab-generated interaction plot representing weights of poplar trees grown at different sites (site 1 and site 2) with different treatments (none,
Shown below is a Minitab-generated interaction plot representing weights of poplar trees grown at different sites (site 1 and site 2) with different treatments (none, fertilizer, irrigation, fertilizer and irrigation). What does this graph suggest about the interaction between the two factors?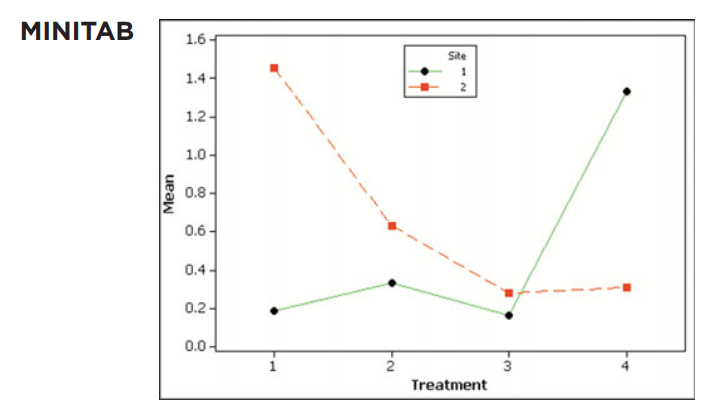
MINITAB 1.6 Site 1.4 - 1.2- 1.0- 0.8- 0.6- 0.4- 0.2 0.0 Treatment Mean
Step by Step Solution
★★★★★
3.49 Rating (156 Votes )
There are 3 Steps involved in it
1 Expert Approved Answer
Step: 1 Unlock

This graph suggests that there is a significant interaction between the two factors The ... View full answer
Question Has Been Solved by an Expert!
Get step-by-step solutions from verified subject matter experts
Step: 2 Unlock
Step: 3 Unlock