

The contingency table shows the results of a random sample of fatally injured passenger vehicle drivers (with
Question:
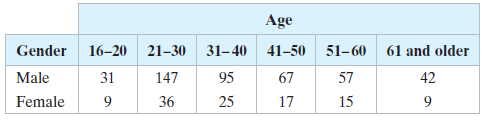
The contingency table shows the results of a random sample of fatally injured passenger vehicle drivers (with blood alcohol concentrations greater than or equal to 0.08) by age and gender. At α = 0.05, can you conclude that age is related to gender in such alcohol-related accidents?
Perform the indicated chi-square independence test by performing the steps below.
(a) Identify the claim and state H0 and Ha.
(b) Determine the degrees of freedom, find the critical value, and identify the rejection region.
(c) Find the chi-square test statistic.
(d) Decide whether to reject or fail to reject the null hypothesis.
(e) Interpret the decision in the context of the original claim
Step by Step Answer:
a The claim is age and gender are ...View the full answer


Elementary Statistics Picturing The World
ISBN: 9780134683416
7th Edition
Authors: Ron Larson, Betsy Farber
