

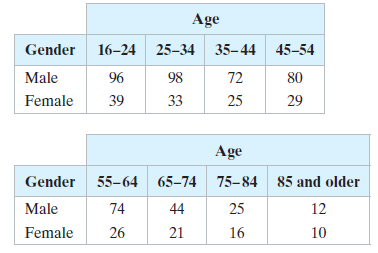
The contingency table shows the results of a random sample of motor vehicle crash deaths by age
Question:
The contingency table shows the results of a random sample of motor vehicle crash deaths by age and gender. At α = 0.05, perform a homogeneity of proportions test on the claim that the proportions of motor vehicle crash deaths involving males or females are the same for each age group.
Fantastic news! We've Found the answer you've been seeking!
Step by Step Answer:
The claim is the proportions of motor vehicle crash deaths involving males and females are the sa...View the full answer

Answered By
Nyron Beeput
I am an active educator and professional tutor with substantial experience in Biology and General Science. The past two years I have been tutoring online intensively with high school and college students. I have been teaching for four years and this experience has helped me to hone skills such as patience, dedication and flexibility. I work at the pace of my students and ensure that they understand.
My method of using real life examples that my students can relate to has helped them grasp concepts more readily. I also help students learn how to apply their knowledge and they appreciate that very much.
1+ Reviews
10+ Question Solved
Related Book For 

Elementary Statistics Picturing The World
ISBN: 9780134683416
7th Edition
Authors: Ron Larson, Betsy Farber
Question Posted:
