

The table shows the numbers of new-vehicle sales (in thousands) in the United States for Toyota and
Question:
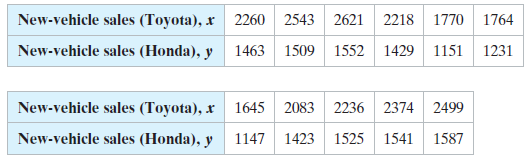
The table shows the numbers of new-vehicle sales (in thousands) in the United States for Toyota and Honda for 11 years. The equation of the regression line is ŷ = 0.460x + 410.839.
Use the data to
(a) Find the coefficient of determination r2 and interpret the result, and
(b) Find the standard error of estimate se and interpret the result.
Fantastic news! We've Found the answer you've been seeking!
Step by Step Answer:
a About 894 of the variation in the newvehicle sales of Honda can be ...View the full answer

Answered By
FREDRICK MUSYOKI
Professional Qualities:
Solution-oriented.
Self-motivated.
Excellent problem-solving and critical thinking skills.
Good organization, time management and prioritization.
Efficient troubleshooting abilities.
Tutoring Qualities:
I appreciate students as individuals.
I am used to tailoring resources for individual needs.
I can integrate IT into student's lessons.
I am good at explaining concepts.
I am able to help students progress.
I have a wide curriculum knowledge.
1+ Reviews
10+ Question Solved
Related Book For 

Elementary Statistics Picturing The World
ISBN: 9780134683416
7th Edition
Authors: Ron Larson, Betsy Farber
Question Posted:
