

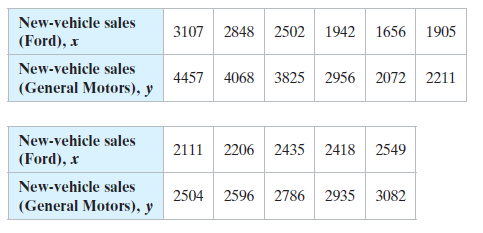
The table shows the numbers of new-vehicle sales (in thousands) in the United States for Ford and
Question:
The table shows the numbers of new-vehicle sales (in thousands) in the United States for Ford and General Motors for 11 years. The equation of the regression line is ŷ = 1.624x - 747.304.
Use the data to
(a) Find the coefficient of determination r2 and interpret the result, and
(b) Find the standard error of estimate se and interpret the result.
Fantastic news! We've Found the answer you've been seeking!
Step by Step Answer:
a About 816 of the variation in the newvehicle sales of General Motors can ...View the full answer

Answered By
Bhartendu Goyal
Professional, Experienced, and Expert tutor who will provide speedy and to-the-point solutions. I have been teaching students for 5 years now in different subjects and it's truly been one of the most rewarding experiences of my life. I have also done one-to-one tutoring with 100+ students and help them achieve great subject knowledge. I have expertise in computer subjects like C++, C, Java, and Python programming and other computer Science related fields. Many of my student's parents message me that your lessons improved their children's grades and this is the best only thing you want as a tea...
2+ Reviews
10+ Question Solved
Related Book For 

Elementary Statistics Picturing The World
ISBN: 9780134683416
7th Edition
Authors: Ron Larson, Betsy Farber
Question Posted:
