

Question: Use a pie chart to display the data, which represent the numbers of student loan borrowers (in millions) by balance owed in the fourth quarter
Use a pie chart to display the data, which represent the numbers of student loan borrowers (in millions) by balance owed in the fourth quarter of 2015.
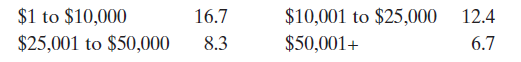
Organize the data using the indicated type of graph. Describe any patterns.
12.4 $1 to $10,000 $25,001 to $50,000 $10,001 to $25,000 $50,001+ 16.7 8.3 6.7
Step by Step Solution
★★★★★
3.38 Rating (179 Votes )
There are 3 Steps involved in it
1 Expert Approved Answer
Step: 1 Unlock

Sample answer The majority of student loan borrowers owe 25000 or les... View full answer
Question Has Been Solved by an Expert!
Get step-by-step solutions from verified subject matter experts
Step: 2 Unlock
Step: 3 Unlock