

Question: Use a pie chart to display the data, which represent the numbers of student loan borrowers (in millions) by balance owed in a recent quarter.
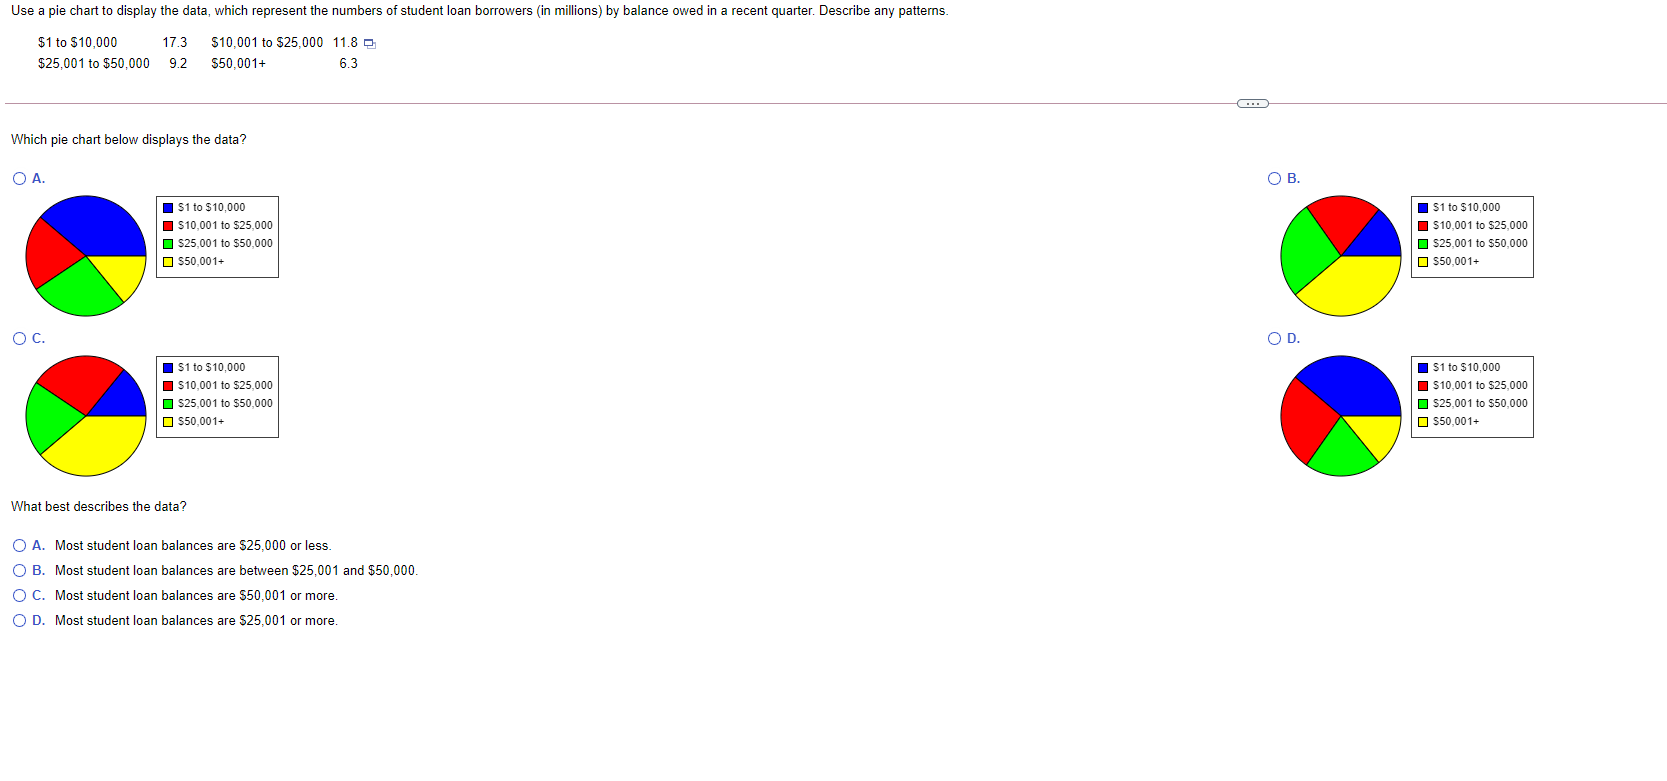
Use a pie chart to display the data, which represent the numbers of student loan borrowers (in millions) by balance owed in a recent quarter. Describe any patterns. $1 to $10,000 17.3 $10,001 to $25,000 11.8 $25,001 to $50,000 9.2 $50,001+ 6.3 Which pie chart below displays the data? O A. O B. $1 to $10,000 $1 to $10,000 $10,001 to $25,000 $10,001 to $25,000 $25,001 to $50,000 "$25,001 to $50,000 $50,001+ $50,001+ O C. OD. $1 to $10,000 $1 to $10,000 1 $10,001 to $25,000 $10,001 to $25,000 $25,001 to $50,000 $25,001 to $50,000 $50,001+ $50,001+ What best describes the data? O A. Most student loan balances are $25,000 or less O B. Most student loan balances are between $25,001 and $50,000. O C. Most student loan balances are $50,001 or more. O D. Most student loan balances are $25,001 or more
Step by Step Solution
There are 3 Steps involved in it

Get step-by-step solutions from verified subject matter experts