Use the same scale to construct boxplots for the weights of regular Coke and regular Pepsi from
Question:
Use the same scale to construct boxplots for the weights of regular Coke and regular Pepsi from Data Set 17 in Appendix B. Use the boxplots to compare the two data sets.
Transcribed Image Text:
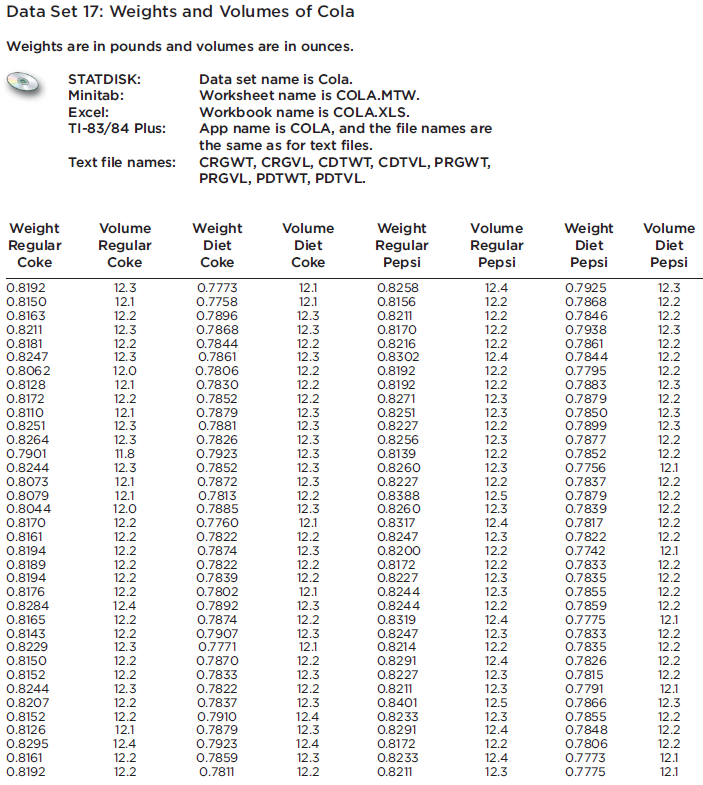
Data Set 17: Weights and Volumes of Cola Weights are in pounds and volumes are in ounces. STATDISK: Data set name is Cola. Minitab: Worksheet name is COLA.MTW. Excel: Workbook name is COLA.XLS. TI-83/84 Plus: App name is COLA, and the file names are the same as for text files. Text file names: CRGWT, CRGVL, CDTWT, CDTVL, PRGWT, PRGVL, PDTWT, PDTVL. Weight Weight Regular Coke Volume Weight Diet Volume Weight Regular Pepsi Volume Volume Regular Diet Regular Pepsi Diet Diet Coke Coke Coke Pepsi Pepsi 0.8258 0.8156 0.8192 12.3 0.7925 0.7773 0.7758 0.7896 0.7868 12.1 12.4 12.3 0.8150 0.8163 12.1 12.1 12.2 12.2 0.7868 12.2 12.2 12.3 12.3 0.8211 0.7846 12.2 0.8170 0.8216 0.8302 12.3 12.2 12.2 0.8211 12.3 12.2 0.7938 0.8181 0.8247 12.2 0.7844 0.7861 12.2 12.3 12.2 12.4 0.7861 12.3 12.0 0.7844 0.7795 0.8062 12.2 12.2 0.7806 0.8192 0.8192 0.8271 0.8251 0.8227 12.2 12.2 12.3 12.2 12.3 12.3 0.8128 12.1 0.7830 0.7852 12.2 0.7883 0.7879 0.8172 12.2 12.2 12.3 12.3 12.2 12.3 12.2 0.8110 0.8251 12.1 12.3 0.7879 0.7881 0.7826 0.7923 0.7852 12.3 12.3 0.7850 0.7899 0.8256 0.8139 0.8260 0.8227 0.8264 12.3 11.8 12.3 12.3 0.7877 12.2 0.7901 0.7852 0.7756 12.2 12.1 0.8244 12.3 12.3 12.3 12.2 12.3 0.8073 0.8079 0.8044 12.1 0.7872 0.7837 0.7813 0.7885 0.7760 12.5 12.3 12.4 12.2 12.2 12.2 12.2 12.2 12.1 12.0 12.2 12.3 0.8388 0.8260 0.8317 0.7879 0.7839 0.7817 0.8170 0.8161 12.2 12.1 0.7822 0.7874 0.7822 0.7839 12.2 12.2 0.8247 12.3 12.2 0.7822 0.7742 0.8194 0.8189 0.8194 12.2 12.3 0.8200 0.8172 0.8227 12.1 12.2 12.2 12.2 12.2 12.2 0.7833 0.7835 12.2 12.2 12.3 12.3 0.8176 12.2 0.7802 12.1 0.8244 0.7855 12.2 12.3 12.2 12.3 12.1 0.8244 0.8319 0.8284 12.4 0.7892 12.2 0.7859 12.2 0.7775 0.7833 0.7835 0.7826 0.7815 0.8165 12.2 12.2 12.3 0.7874 12.4 12.1 0.8143 0.8229 0.7907 0.8247 0.8214 12.3 12.2 12.2 12.2 0.7771 0.7870 0.8150 0.8152 12.2 12.2 12.2 0.8291 0.8227 0.8211 12.4 12.2 12.3 12.2 0.7833 12.3 12.3 12.5 12.3 12.4 12.2 0.8244 0.8207 12.3 0.7822 0.7791 0.7866 12.1 12.2 0.7837 12.3 0.8401 12.3 0.8152 0.8126 12.2 12.2 12.2 0.7910 0.7879 0.7923 12.4 0.8233 0.7855 0.7848 12.1 12.3 12.4 0.8291 0.8172 0.8295 12.4 12.2 0.7806 12.2 0.8161 12.2 0.7859 12.3 0.8233 12.4 0.7773 12.1 0.8192 12.2 0.7811 12.2 0.8211 12.3 0.7775 12.1
Fantastic news! We've Found the answer you've been seeking!
Step by Step Answer:
Answer rating: 66% (12 reviews)
Using the MINITAB5 number summary and box plots for the weights of Regular Coke an...View the full answer
Answered By
Mugdha Sisodiya
My self Mugdha Sisodiya from Chhattisgarh India. I have completed my Bachelors degree in 2015 and My Master in Commerce degree in 2016. I am having expertise in Management, Cost and Finance Accounts. Further I have completed my Chartered Accountant and working as a Professional.
Since 2012 I am providing home tutions.
3.30+
2+ Reviews
10+ Question Solved
Related Book For
Question Posted:
Students also viewed these Mathematics questions
-
Use the same scale to construct boxplots for the pulse rates of males and females from Data Set 1 "Body Data" in Appendix B. Use the given data sets in Appendix B. Use the boxplots to compare the two...
-
Use the same scale to construct boxplots for the full IQ scores (IQF) for the low lead level group (group 1) and the high lead level group (group 3) in Data Set 7 "IQ and Lead" in Appendix B. Use the...
-
Use the same scale to construct boxplots for the home voltage amounts and the generator voltage amounts from Data Set 13 in Appendix B. Use the boxplots to compare the two data sets. Data Set 13:...
-
Create a Stored Procedure: Stored procedures allow you to make changes to the database structure and manage performance without needing to rewrite applications or deploy application updates. In this...
-
Use nodal analysis along with MATAB to determine the node voltages in Fig. 3.74? Figure 3.74 For Prob. 3.25. 20 4 30 4 A 8 20
-
The process of management involves the functions of planning, ____________, leading, and controlling. (a) accounting (b) creating (c) innovating (d) organizing
-
In general how have interest rates changed since the late 1980s according to Figure 11.1? FIGURE 11.1 Interest and Inflation Rates, 1988-2010 10p Rate (%) 8 6 10-Year Treasury Bonds 4 2 AAA Corporate...
-
Develop an EOQ solution and calculate total relevant costs for the data in the preceding table. Stockout costs equal $10 per unit. *Holding cost = $2.50/unit/week; setup cost = $150; lead time = 1...
-
The bar BC exerts a force on the cables at B that is directed along the line from C to B. (Figure 1) The mass of the suspended load is 190 kg. Suppose that = 20 and = 20. Part A What is the tension...
-
How would the companys cash needs change for the company in Examples 14-1 to 14-5 if the third project started in May instead of February and the retention was not released until the following year?
-
Find the mean of the data summarized in the given frequency distribution. Also, compare the computed means to the actual means obtained by using the original list of data values, which are as...
-
A student of the author earned grades of B, C, B, A, and D. Those courses had these corresponding numbers of credit hours: 3, 3, 4, 4, and 1. The grading system assigns quality points to letter...
-
Solve the given problems. Use a ruler and protractor as in Examples 6 and 7. A ship travels 20 km in a direction of 30 south of east, then turns and goes due south for another 40 km, and finally...
-
Assume that there are two sectors in an economy: goods (G) and services (S). Both sectors are perfectly competitive, with large numbers of firms and constant returns to scale. As income rises,...
-
This second exercise relates to turnaround and change management. Identify a company that is in dire financial straits. What are the financial symptoms of this distress? Do you think the cause of...
-
In a business dinner at which a few board members and top executives are attending, you overhear directors mentioning that the CEOs office has been bugged because they think he is negotiating behind...
-
Identify a firm and document its alliance activity over the past five to ten years (visit the Web site of a public firm, particularly the history page). Examine the list of officers at the company...
-
As part of a corporate restructuring, your analysis helps you conclude that you have rather extensive redundancy in corporate finance and accounting positions. Management concludes that through...
-
A university decides to offer students two different tuition options. In the first, a new freshman can pay a one-time fixed payment of $100,000. In the second, the student would make four annual...
-
Provide a few individual examples who revealed what aspects of emotional intelligence?
-
In addition to testing for a linear correlation between x and y, we can often use transformations of data to explore other relationships. For example, we might replace each x value by x2 and use the...
-
Table A-6 lists critical values of r for selected values of n and a. More generally, critical r values can be found by using the formula Where the t value is found from the table of critical t values...
-
Use the given data to find the equation of the regression line. Examine the scatterplot and identify a characteristic of the data that is ignored by the regression line. x10 813 9 11 14 64 1275 y...
-
A 1 kg metal block is heated to 200 C and then dropped into a thermally isolated container with 4 kg of water and 100 gr of ice both at a temperature of 0 C. If the specific heat of water is cw=4186...
-
Why are both ER Diagrams and Relational Modeling needed when a database system is developed?
-
Which data model provides a user with the best "program-data independence"? A. Hierarchial Model B. Network Model C. Relational Model D. Entity Relationship Model Why?
Study smarter with the SolutionInn App