

Question: Use the same scale to construct boxplots for the weights of the pre-1964 silver quarters and the post-1964 quarters from Data Set 20 in Appendix
Use the same scale to construct boxplots for the weights of the pre-1964 silver quarters and the post-1964 quarters from Data Set 20 in Appendix B. Use the boxplots to compare the two data sets.
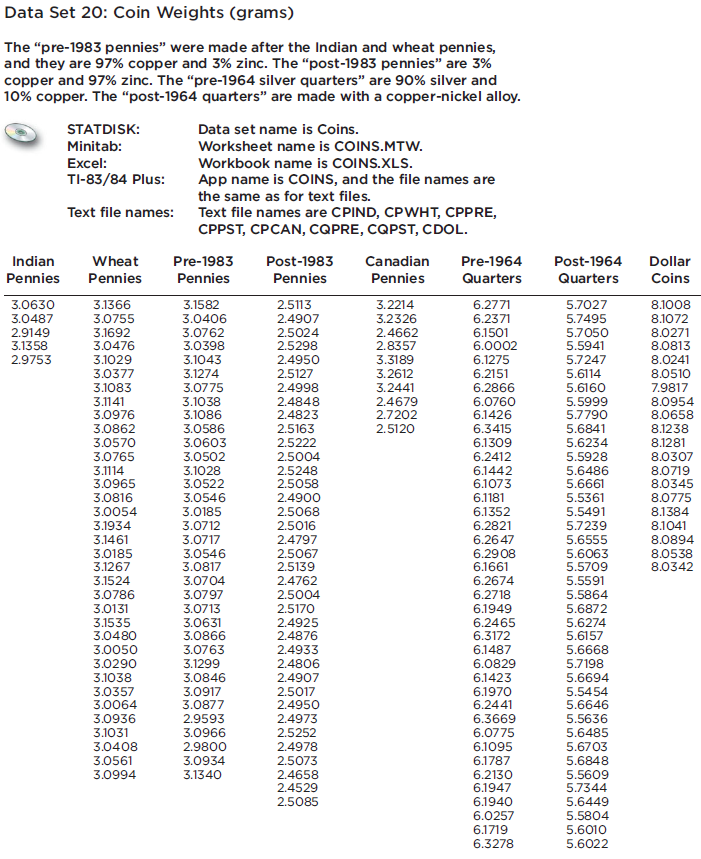
Data Set 20: Coin Weights (grams) The "pre-1983 pennies" were made after the Indian and wheat pennies, and they are 97% copper and 3% zinc. The "post-1983 pennies" are 3% copper and 97% zinc. The pre-1964 silver quarters" are 90% silver and 10% copper. The post-1964 quarters" are made with a copper-nickel alloy. STATDISK: Data set name is Coins. Minitab: Worksheet name is COINS.MTW. Excel: Workbook name is COINS.XLS. TI-83/84 Plus: App name is COINS, and the file names are the same as for text files. Text file names: Text file names are CPIND, CPWHT, CPPRE, CPPST, CPCAN, CQPRE, CQPST, CDOL. Indian Wheat Pre-1983 Post-1983 Canadian Pre-1964 Post-1964 Dollar Pennies Pennies Pennies Pennies Pennies Quarters Quarters Coins 3.0630 3.1366 3.1582 2.5113 3.2214 6.2771 5.7027 8.1008 3.0487 3.0755 3.0406 3.0762 2.4907 2.5024 2.5298 3.2326 6.2371 5.7495 8.1072 2.9149 3.1692 3.0476 3.1029 3.0377 3.1083 3.1358 2.9753 3.0398 3.1043 2.4662 2.8357 6.1501 6.0002 6.1275 5.7050 5.5941 8.0271 8.0813 2.4950 3.3189 5.7247 8.0241 3.2612 3.2441 2.4679 2.7202 3.1274 2.5127 6.2151 5.6114 8.0510 7.9817 3.0775 2.4998 6.2866 5.6160 6.0760 6.1426 3.1141 3.1038 3.1086 3.0586 3.0603 2.4848 5.5999 5.7790 8.0954 3.0976 3.0862 2.4823 2.5163 2.5222 8.0658 8.1238 2.5120 6.3415 5.6841 3.0570 3.0765 6.1309 5.6234 5.5928 8.1281 3.0502 3.1028 3.0522 2.5004 6.2412 8.0307 8.0719 8.0345 3.1114 2.5248 6.1442 6.1073 6.1181 6.1352 6.2821 5.6486 5.6661 5.5361 5.5491 3.0965 2.5058 2.4900 2.5068 3.0816 3.0546 8.0775 8.1384 3.0054 3.0185 3.0712 3.1934 2.5016 5.7239 5.6555 5.6063 5.5709 5.5591 5.5864 8.1041 3.0717 3.0546 3.0817 2.4797 6.2647 6.2908 6.1661 3.1461 8.0894 3.0185 3.1267 2.5067 2.5139 8.0538 8.0342 3.1524 3.0704 2.4762 2.5004 2.5170 6.2674 3.0786 3.0797 3.0713 3.0631 3.0866 6.2718 3.0131 6.1949 6.2465 6.3172 6.1487 6.0829 6.1423 5.6872 3.1535 2.4925 5.6274 3.0480 5.6157 2.4876 2.4933 3.0050 3.0763 5.6668 3.0290 3.1299 5.7198 2.4806 2.4907 3.1038 3.0846 5.6694 3.0357 3.0917 2.5017 2.4950 2.4973 2.5252 6.1970 6.2441 5.5454 5.6646 5.5636 5.6485 3.0064 3.0936 3.0877 2.9593 6.3669 6.0775 3.1031 3.0966 6.1095 6.1787 6.2130 6.1947 3.0408 2.9800 2.4978 5.6703 5.6848 3.0561 3.0994 3.0934 2.5073 2.4658 2.4529 5.5609 5.7344 3.1340 6.1940 6.0257 2.5085 5.6449 5.5804 5.6010 5.6022 6.1719 6.3278
Step by Step Solution
3.46 Rating (162 Votes )
There are 3 Steps involved in it
The data is given below Now to make boxplot use STATDISK The procedure is given below 1 Enter the da... View full answer

Get step-by-step solutions from verified subject matter experts
Document Format (2 attachments)
1545_605d88e21b20a_818282.pdf
180 KBs PDF File
1545_605d88e21b20a_818282.docx
120 KBs Word File