

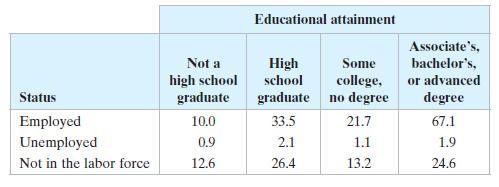
What percent of U.S. adults ages 25 and over who are employed have a degree? Use the
Question:
What percent of U.S. adults ages 25 and over who are employed have a degree?
Use the contingency table, and the information below. Relative frequencies can also be calculated based on the row totals (by dividing each row entry by the row’s total) or the column totals (by dividing each column entry by the column’s total). These frequencies are conditional relative frequencies and can be used to determine whether an association exists between two categories in a contingency table.
Fantastic news! We've Found the answer you've been seeking!
Step by Step Answer:

Answered By
Mugdha Sisodiya
My self Mugdha Sisodiya from Chhattisgarh India. I have completed my Bachelors degree in 2015 and My Master in Commerce degree in 2016. I am having expertise in Management, Cost and Finance Accounts. Further I have completed my Chartered Accountant and working as a Professional.
Since 2012 I am providing home tutions.
2+ Reviews
10+ Question Solved
Related Book For 

Elementary Statistics Picturing The World
ISBN: 9780134683416
7th Edition
Authors: Ron Larson, Betsy Farber
Question Posted:
