

Question: When finding critical values, we sometimes need significance levels other than those available in Table A-3. Some computer programs approximate critical t values by calculating
When finding critical values, we sometimes need significance levels other than those available in Table A-3. Some computer programs approximate critical t values by calculating
![]()
where df = n - 1, e = 2.718, A = z(8 ? df + 3)/(8? df + 1), and z is the critical z score. Use this approximation to find the critical t score corresponding to and a significance level of 0.05 in a right-tailed case. Compare the results to n = 75 the critical t value of 1.666 found from STATDISK or a TI-83 84 Plus calculator.
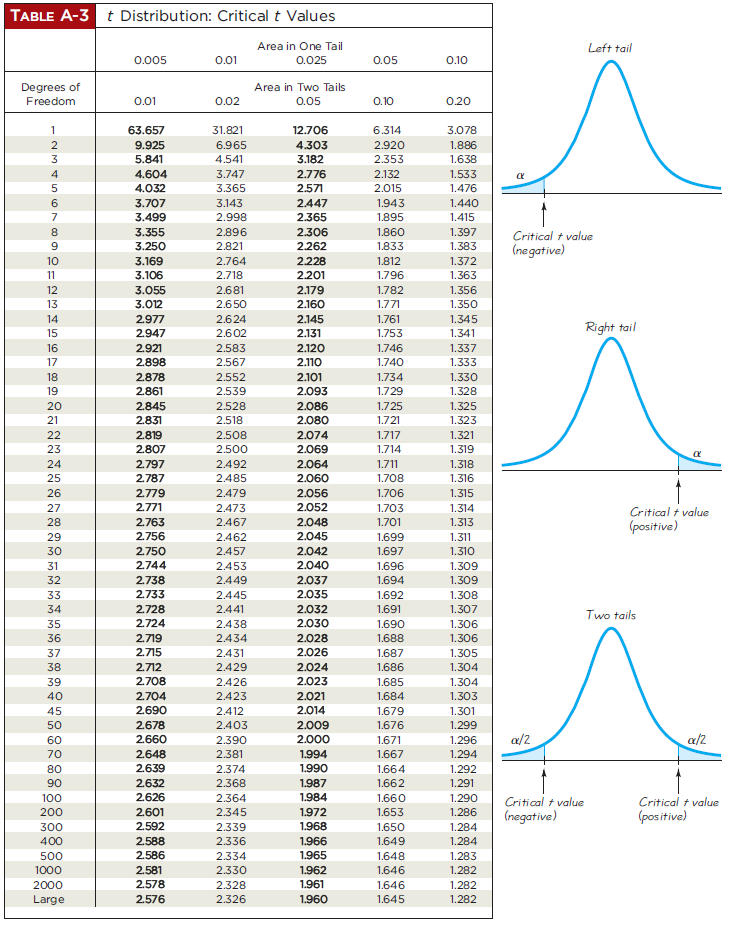
t = df (e4/df - 1) . TABLE A-3 t Distribution: Critical t Values Area in One Tail 0.025 Degrees of Freedom 88888gowwwwwwwwwwNDNOGAWN 20 30 32 34 45 35 40 50 60 70 80 90 100 200 300 400 500 1000 2000 Large 0.005 0.01 63.657 9.925 5.841 4.604 4.032 3.707 3.499 3.355 3.250 3.169 3.106 3.055 3.012 2.977 2.947 2.921 2.898 2.878 2.861 2.845 2.831 2.819 2.807 2.797 2.787 2.779 2.771 2.763 2.756 2.750 2.744 2.738 2.733 2.728 2.724 2.719 2.715 2.712 2.708 2.704 2.690 2.678 2.660 2.648 2.639 2.632 2.626 2.601 2.592 2.588 2.586 2.581 2.578 2.576 0.01 0.02 31.821 6.965 4.541 3.747 3.365 3.143 2.998 2.896 2.821 2.764 2.718 2.681 2.650 2.624 2.602 2.583 2.567 2.552 2.539 2.528 2.518 2.508 2.500 2.492 2.485 2.479 2.473 2.467 2.462 2.457 2.453 2.449 2.445 2.441 2.438 2.434 2.431 2.429 2.426 2.423 2.412 2.403 2.390 2.381 2.374 2.368 2.364 2.345 2.339 2.336 2.334 2.330 2.328 2.326 Area in Two Tails 0.05 12.706 4.303 3.182 2.776 2.571 2.447 2.365 2.306 2.262 2.228 2.201 2.179 2.160 2.145 2.131 2.120 2.110 2.101 2.093 2.086 2.080 2.074 2.069 2.064 2.060 2.056 2.052 2.048 2.045 2.042 2.040 2.037 2.035 2.032 2.030 2.028 2.026 2.024 2.023 2.021 2.014 2.009 2.000 1.994 1.990 1.987 1.984 1.972 1.968 1.966 1.965 1.962 1.961 1.960 0.05 0.10 6.314 2.920 2.353 2.132 2.015 1.943 1.895 1.860 1.833 1.812 1.796 1.782 1.771 1.761 1.753 1.746 1.740 1.734 1.729 1.725 1.721 1.717 1.714 1.711 1.708 1.706 1.703 1.701 1.699 1.697 1.696 1.694 1.692 1.691 1.690 1.688 1.687 1.686 1.685 1.684 1.679 1.676 1.671 1.667 1.664 1.662 1.660 1.653 1.650 1.649 1.648 1.646 1.646 1.645 0.10 0.20 3.078 1.886 1.638 1.533 1.476 1.440 1.415 1.397 1.383 1.372 1.363 1.356 1.350 1.345 1.341 1.337 1.333 1.330 1.328 1.325 1.323 1.321 1.319 1.318 1.316 1.315 1.314 1.313 1.311 1.310 1.309 1.309 1.308 1.307 1.306 1.306 1.305 1.304 1.304 1.303 1.301 1.299 1.296 1.294 1.292 1.291 1.290 1.286 1.284 1.284 1.283 1.282 1.282 1.282 Left tail Critical + value (negative) a/2 Right tail Critical + value (negative) Critical + value (positive) Two tails /2 Critical + value (positive)
Step by Step Solution
3.42 Rating (165 Votes )
There are 3 Steps involved in it
To find the critical t score corresponding to a significance level of ... View full answer

Get step-by-step solutions from verified subject matter experts