

Question: When using Table A-1 to find the probability of guessing and getting exactly 8 correct answers on a multiple choice test with 10 questions, the
When using Table A-1 to find the probability of guessing and getting exactly 8 correct answers on a multiple choice test with 10 questions, the result is found to be 0+. What does 0+ indicate? Does 0+ indicate that it is it impossible to get exactly 8 correct answers?
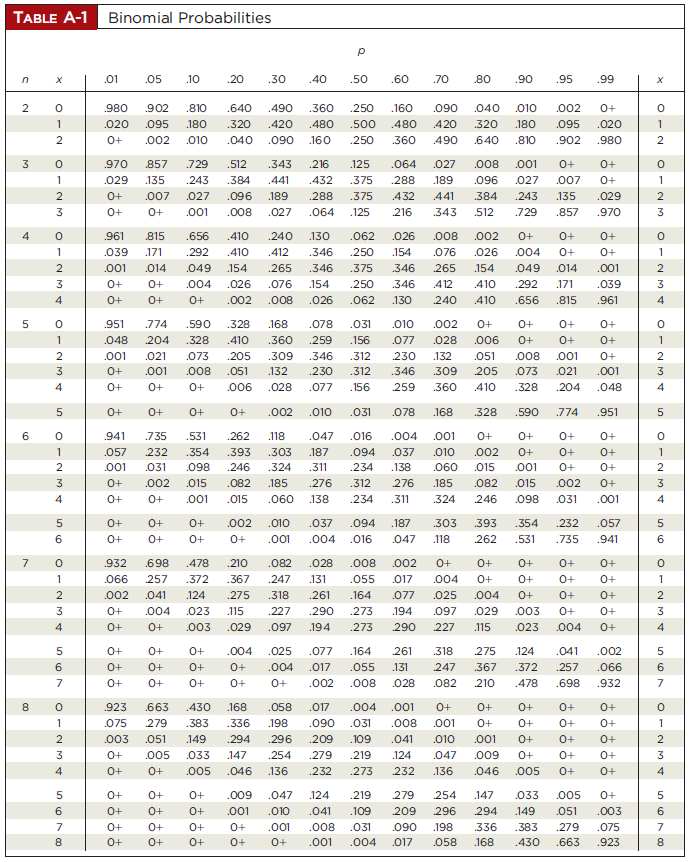
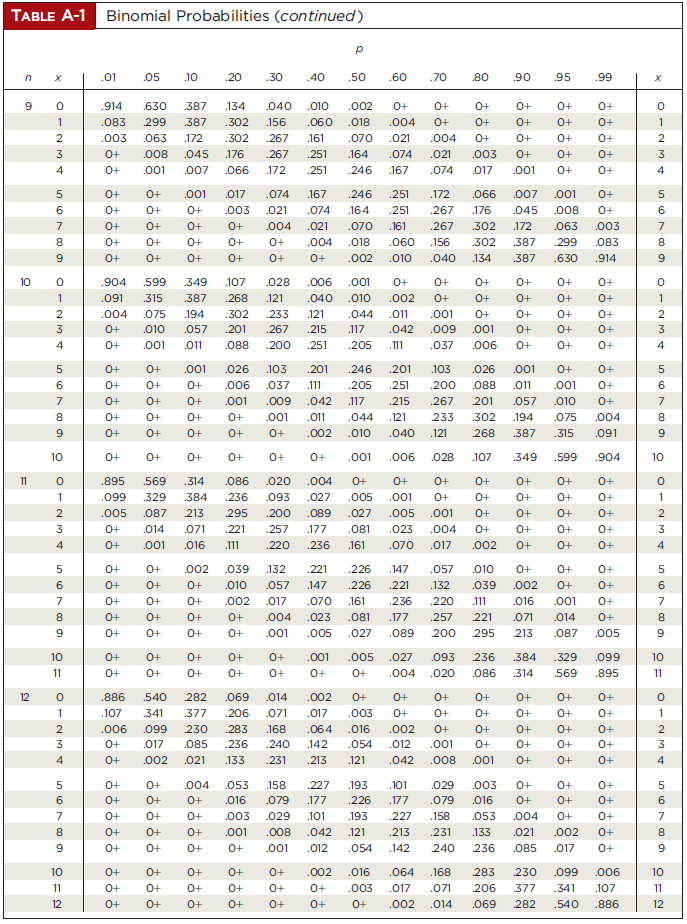
TABLE A-1 Binomial Probabilities (continued) .01 .05 .10 .20 .30 .40 .50 .60 .70 .80 .90 95 .99 .914 .630 387 .134 .040 .010 .002 O+ O+ O+ 0+ 0+ 0+ .083 299 .387 .302 .156 .060 .018 .004 0+ O+ 0+ O+ 0+ .003 .063 .172 .302 .267 .161 .070 .021 .004 0+ 0+ 0+ 0+ O+ .008 .045 .176 .267 .251 .164 .074 .021 .003 0+ O+ 0+ 3 0+ .01 .007 .066 .172 .251 .246 .167 .074 .017 .001 0+ 0+ 4. 0+ O+ .01 .017 .074 167 .246 .251 .172 .066 .007 .01 0+ 0+ 0+ 0+ .003 .021 .074 164 .251 .267 .176 .045 .008 0+ 0+ O+ 0+ 0+ .004 .021 .070 .161 .267 .302 .172 .063 .003 O+ O+ O+ 0+ 0+ 0+ .004 .018 .060 .156 .302 387 .299 .083 9. O+ 0+ 0+ 0+ .002 .010 .040 134 .387 .630 .914 9. 10 .904 .599 .349 .107 .028 .006 .001 0+ O+ O+ 0+ 0+ .091 .315 .387 .268 .121 .040 .010 .002 O+ 0+ 0+ 0+ .004 .075 194 .302 .233 .121 .044 .011 .001 0+ 0+ 0+ 0+ .010 .057 .201 .267 .215 .117 .042 .009 .01 0+ 0+ 0+ O+ .01 .11 .088 .200 .251 .205 .11 .037 .006 0+ 0+ 0+ 4. 0+ O+ .01 .026 103 .201 .246 .201 .103 .026 .01 0+ 0+ O+ 0+ 0+ .006 .037 .111 .205 .251 .200 .088 .11 .001 0+ O+ O+ 0+ .001 .009 .042 .117 .215 .267 201 .057 .010 0+ 8. O+ 0+ 0+ 0+ .01 .01 .044 .121 233 .302 .194 .075 .004 8. 9. O+ O+ 0+ 0+ 0+ .002 .010 .040 .121 268 387 .315 .091 10 O+ 0+ 0+ 0+ 0+ 0+ .001 .006 .028 107 349 .599 .904 10 11 .895 .569 .314 .086 .020 .004 O+ 0+ O+ O+ 0+ 0+ 0+ .099 .329 384 .236 .093 .027 .005 .001 0+ O+ 0+ 0+ 0+ .005 .087 213 295 .200 .089 .027 .005 .001 0+ 0+ 0+ 0+ O+ .014 071 .221 .257 .177 .081 .023 .004 O+ 0+ 0+ 0+ O+ .01 016 .111 .220 .236 .161 .070 .017 .002 0+ 0+ 0+ O+ 0+ .002 .039 .132 .221 .226 147 .057 010 0+ 0+ 0+ O+ O+ 0+ .010 .057 .147 .226 .221 .132 .039 .002 0+ 0+ 0+ 0+ 0+ .002 .017 .070 .161 .236 .220 .11 .016 .001 0+ 8. O+ 0+ 0+ 0+ .004 .023 .081 .177 .257 221 .071 .014 0+ 8. O+ O+ 0+ 0+ .01 .005 .027 .089 200 295 213 .087 .005 9. 10 O+ O+ 0+ O+ 0+ .001 .005 .027 .093 236 .384 .329 .099 10 11 O+ O+ 0+ 0+ 0+ 0+ O+ .004 .020 .086 .314 .569 .895 11 12 .886 .540 282 .069 .014 .002 O+ O+ 0+ O+ 0+ 0+ 0+ .107 341 .377 .206 .071 .017 .003 O+ O+ O+ 0+ 0+ 0+ .006 .099 230 .283 .168 .064 .016 .002 0+ O+ 0+ 0+ 0+ 0+ .017 .085 .236 .240 .142 .054 .012 .001 O+ 0+ 0+ 0+ 3. O+ .02 .021 .133 .231 .213 .121 .042 .008 .001 0+ 0+ 0+ O+ O+ .004 .053 .158 .227 193 .101 .029 .003 0+ 0+ 0+ 6. 0+ O+ .016 .079 .177 .226 .177 .079 .016 0+ 0+ 0+ 0+ .003 .029 .101 .193 .227 .158 .053 .004 8. .01 .008 .042 .121 .213 .231 .133 .021 .002 8. O+ 0+ .001 .012 .054 .142 240 236 .085 .017 10 O+ O+ 0+ O+ 0+ .002 .016 .064 .168 283 230 .099 .006 10 O+ 0+ 11 0+ 0+ 0+ 0+ 0+ .003 .017 .071 206 377 .341 .107 11 12 0+ 0+ O+ 0+ 0+ O+ .002 .014 .069 282 .540 .886 12 4)
Step by Step Solution
3.44 Rating (173 Votes )
There are 3 Steps involved in it
Explanation The result 0 indicates that it is an isolated numbe... View full answer

Get step-by-step solutions from verified subject matter experts
Document Format (2 attachments)
1545_605d88e225cb5_818514.pdf
180 KBs PDF File
1545_605d88e225cb5_818514.docx
120 KBs Word File