

Question: 1.75 The following graph shows the relationship between three variables: number of licensed drivers, number of registered vehicles, and the size of the resident population
1.75 The following graph shows the relationship between three variables: number of licensed drivers, number of registered vehicles, and the size of the resident population for the United States from 1961 to 2003.
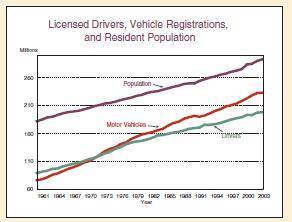
Study the graph and answer the questions.
a. Does it seem reasonable that the Population line and the Drivers line run basically parallel to each other and that the Population line is above the Drivers line? Explain what it means for the lines to be parallel. What would it mean if they were not parallel?
b. The Drivers and Motor Vehicles lines cross.
What does this mean? When did the lines intersect, and what does the point of intersection represent?
200 210 150 Licensed Drivers, Vehicle Registrations, and Resident Population Population Motor Vehic 1961 1964 1967 1970 1979 1978 197 196 195 13 1091 1004 1007 2000 2003
Step by Step Solution
There are 3 Steps involved in it

Get step-by-step solutions from verified subject matter experts