

Question: A sample of students at a certain college was drawn, and the age of each, in years, was determined. The following MINITAB output presents the
A sample of students at a certain college was drawn, and the age of each, in years, was determined. The following MINITAB output presents the results of a hypothesis test regarding the mean age of students at this college.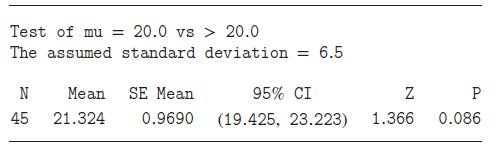
a. What are the null and alternate hypotheses?
b. What is the value of the test statistic?
c. What is the P-value?
d. Do you reject H0 at the α = 0.05 level? State a conclusion.
e. Do you reject H0 at the α = 0.01 level? State a conclusion.
f. Use the results of the output to compute the value of the test statistic z for a test of H0: μ = 24 versus H0: μ ≠ 24.
g. Find the P-value.
h. Do you reject the null hypothesis in part
(f) at the α = 0.05 level? State a conclusion.
Test of mu = 20.0 vs > 20.0 The assumed standard deviation = 6.5 N Mean SE Mean 95% CI Z P 45 21.324 0.9690 (19.425, 23.223) 1.366 0.086
Step by Step Solution
3.34 Rating (163 Votes )
There are 3 Steps involved in it

Get step-by-step solutions from verified subject matter experts