

Question: Body Temperatures The normal quantile plot represents body temperatures of adults from Data Set 3 in the Appendix: Data Sets. z score 3 2.4 1.8
Body Temperatures The normal quantile plot represents body temperatures of adults from Data Set 3 in the Appendix:
Data Sets.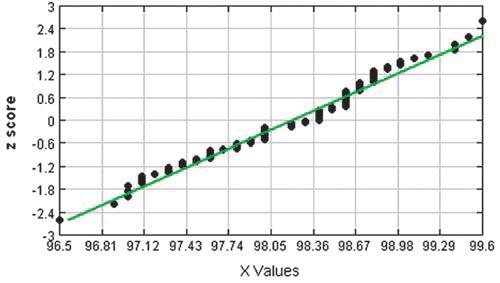
z score 3 2.4 1.8 1.2 0.6 0 -0.6 -1.2 -1.8 -2.4 6.5 96.81 97.12 97.43 97.74 98.05 98.36 98.67 98.98 99.29 99.6 X Values
Step by Step Solution
There are 3 Steps involved in it
1 Expert Approved Answer
Step: 1 Unlock

Question Has Been Solved by an Expert!
Get step-by-step solutions from verified subject matter experts
Step: 2 Unlock
Step: 3 Unlock