

Question: White Blood Cell Counts The normal quantile plot represents white blood cell counts of males from Data Set 1 in the Appendix: Data Sets. z
White Blood Cell Counts The normal quantile plot represents white blood cell counts of males from Data Set 1 in the Appendix: Data Sets.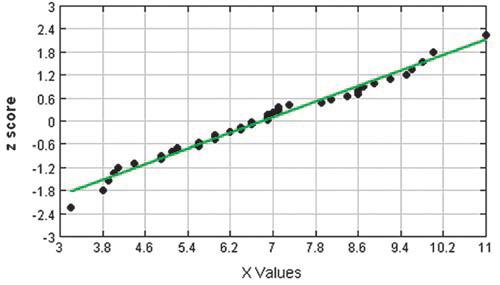
z score 3 2.4 1.8 1.2 0.6 0 -0.6 -1.2 -1.8 -2.4 33 3.8 4.6 5.4 6.2 7 7.8 8.6 9 X Values 9.4 10.2 11
Step by Step Solution
There are 3 Steps involved in it
1 Expert Approved Answer
Step: 1 Unlock

Question Has Been Solved by an Expert!
Get step-by-step solutions from verified subject matter experts
Step: 2 Unlock
Step: 3 Unlock